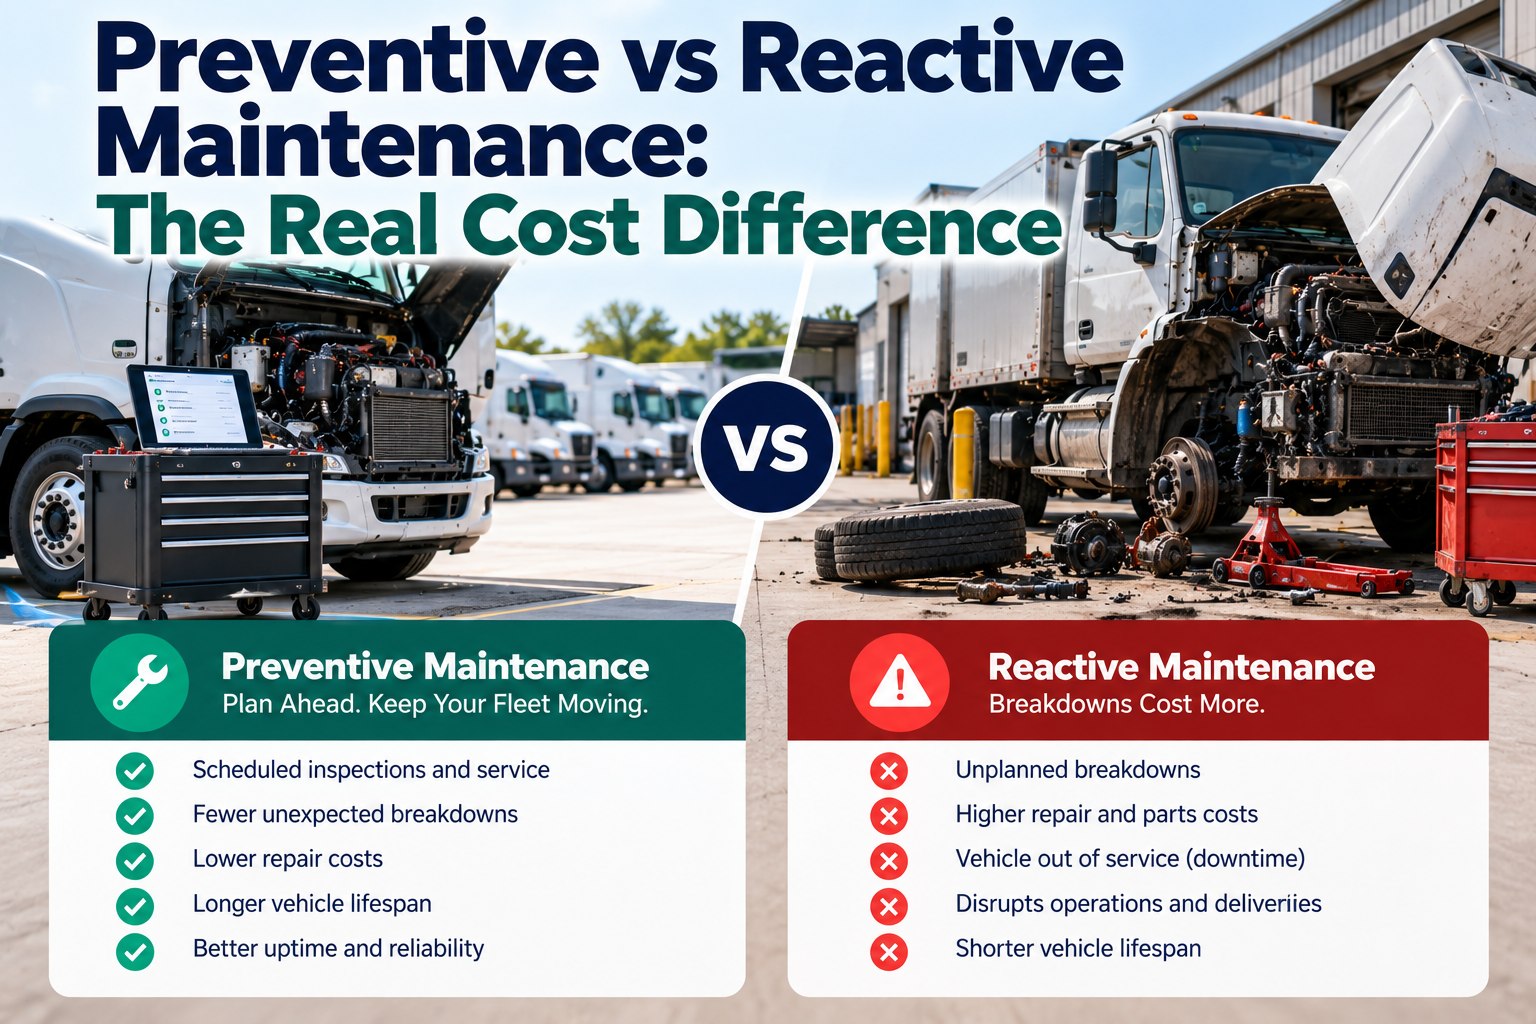
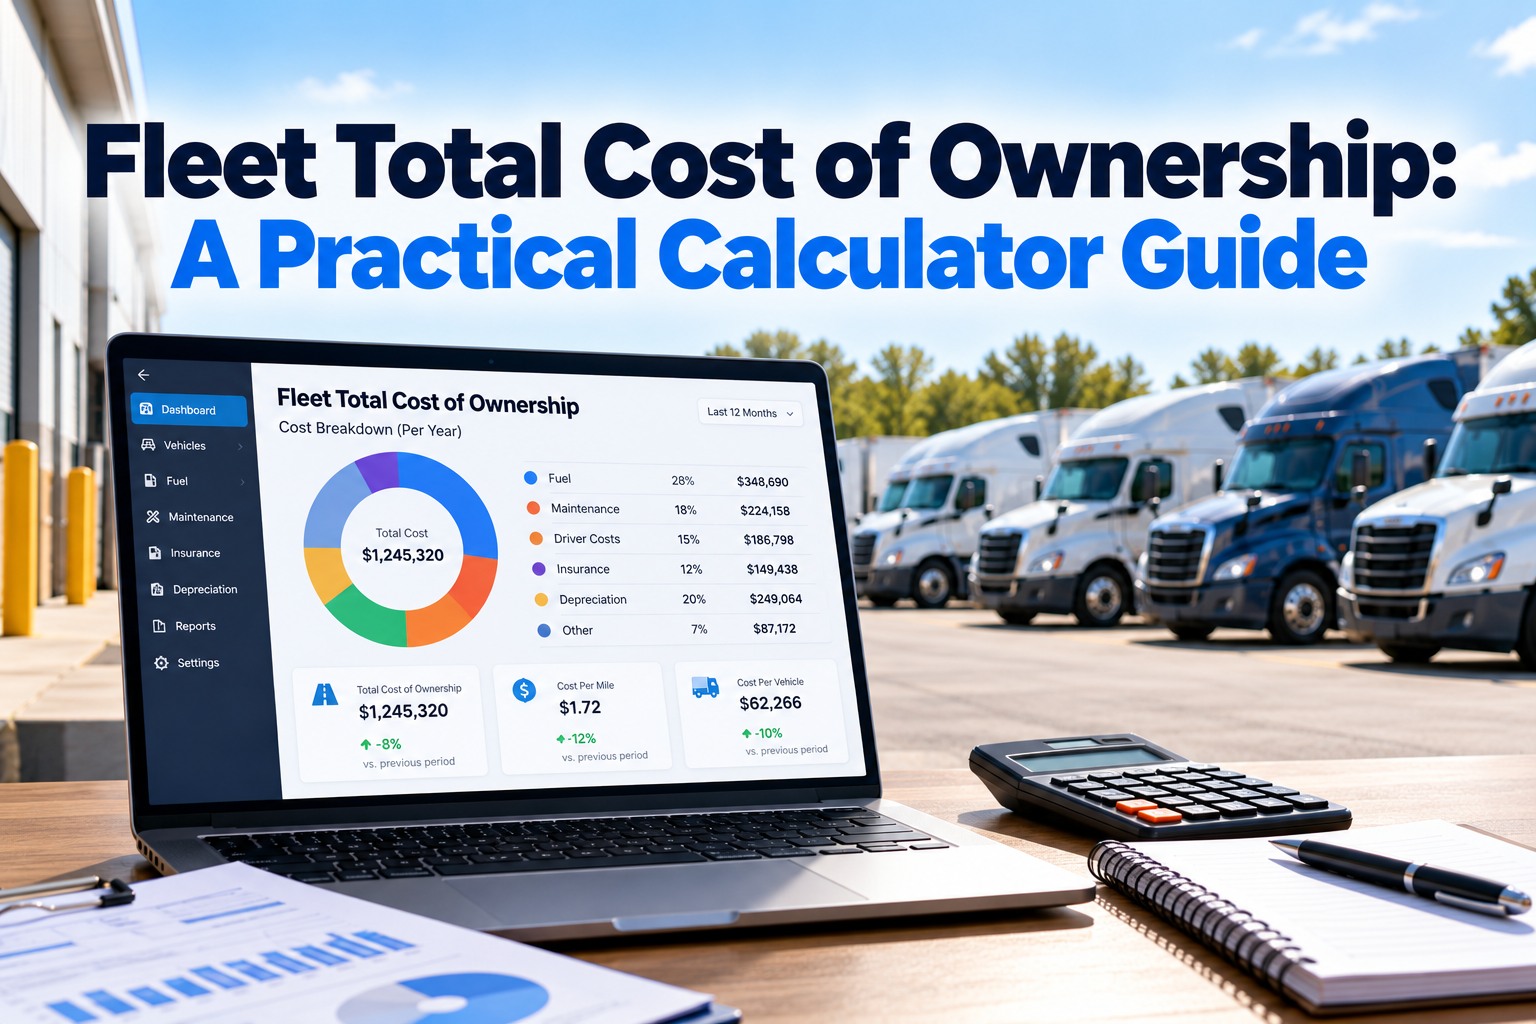
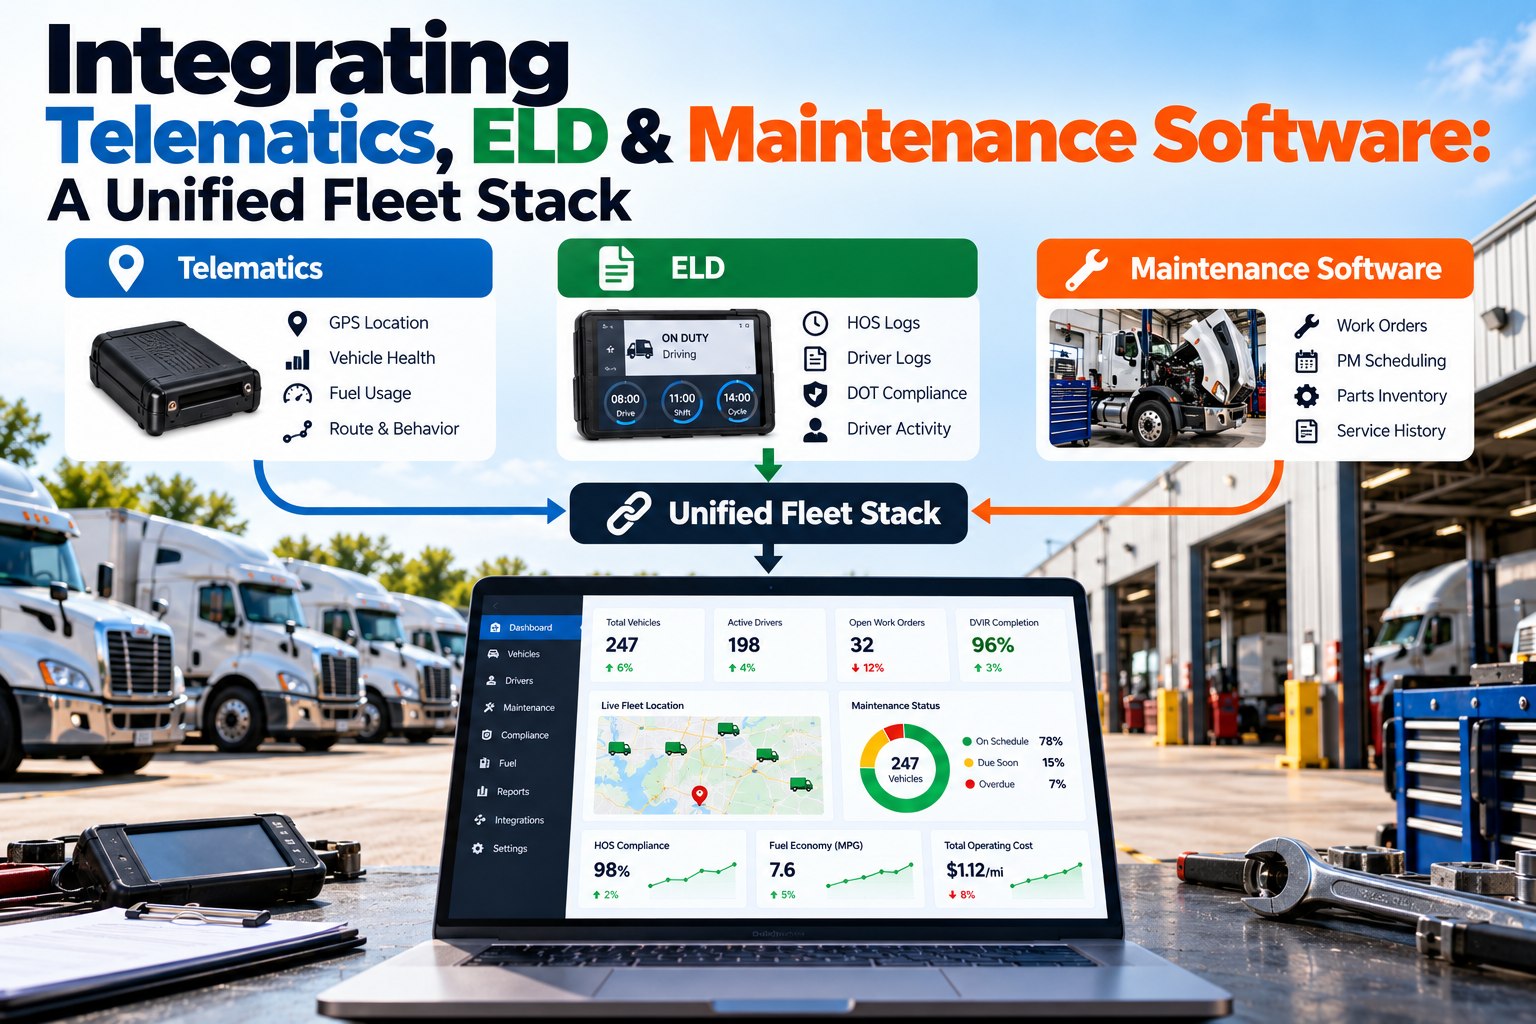
The real cost difference between preventive and reactive maintenance is smaller than the most-repeated claim and larger than most fleets track. A "3 to 5 times" figure circulates widely, but it does not trace to the source it is credited to. This page shows what the evidence actually says, what is measurable in a fleet and how to calculate your own planned versus unplanned cost. Schedule a call to measure planned versus unplanned cost on your fleet.
EVIDENCE CHECK · PREVENTIVE VS REACTIVE MAINTENANCE COST
The Famous 3-to-5-Times Claim Does Not Hold Up, So Measure Your Own Gap
What the Department of Energy guide really says, what has been measured and how to count planned versus unplanned cost.
CLAIMS GRADED BY EVIDENCE
3 to 5 times moreUntraceable
DOE 12 to 18%Estimate
NIST downtime gapMeasured
Not fleet-specific. Measure your own.
Four Claims About the Cost Gap, Graded
Check where each number comes from before you put it in a budget request
Reactive costs 3 to 5 times moreCannot be traced
A widely repeated claim attributed to the U.S. Department of Energy.
The DOE guide does not say this. Its own figures work out to about 1.4 to 1 for reactive versus preventive. The 3 to 1 ratio appears only against reliability-centered maintenance.
Preventive saves 12 to 18 percent over reactiveDOE estimate
Published in the DOE operations and maintenance guide across three editions.
DOE attributes it to unnamed studies, so present it as DOE's estimate and not a measured result.
Reactive $18, preventive $13 per horsepower a yearOld, narrow source
The DOE guide table, identical in all three editions.
It traces to a 2001 trade article about pumps. It measures annual program cost per horsepower, not the cost of a repair, and it is not about trucks.
Unplanned downtime share: 10.4 percent vs 4.9 percentMeasured, other industry
A 2020 NIST survey of U.S. manufacturers: plants relying more on reactive maintenance lost more planned time.
Measures downtime and defects, not repair cost. The authors call the comparison anecdotal given 71 usable responses, and it is manufacturing, not fleets.
What the DOE Figures Actually Show
Reactive costs about 1.4 times preventive in DOE's table, not 3 to 5
The U.S. Department of Energy's Federal Energy Management Program guide, written by Pacific Northwest National Laboratory researchers, lists annual cost per horsepower for four maintenance approaches. The same figures appear in the 2002, 2004 and 2010 editions, and trace to a 2001 article about pumps.
ANNUAL MAINTENANCE COST PER HORSEPOWER BY APPROACH, DOLLARS. DOE FEMP GUIDE, FROM A 2001 PUMP ARTICLE
The one measured study found reactive-heavy plants lost about twice the time
A 2020 National Institute of Standards and Technology survey of U.S. manufacturers found plants more reliant on reactive maintenance lost 10.4 percent of planned production time to unplanned downtime, against 4.9 percent for the rest. It is not about trucks and it measures downtime, not repair cost.
UNPLANNED DOWNTIME AS SHARE OF PLANNED PRODUCTION TIME, PERCENT. NIST SURVEY, 2020, 71 RESPONSES
More reactive plants
10.4%
Other industries are not your fleet. Both studies come from pumps and factories. They show a direction, not a number you can apply to your trucks.
Want your own planned versus unplanned numbers? Schedule a call and we will pull them from your work orders.
The share of repairs that were planned, and what each type costs.
Vendor Claims to Question
Ask for the study and the method behind any figure, ours included
| Vendor claim you may see | Status |
|---|
| Reactive costs 3 to 9 times more | No study named; its own table implies ratios from 3x to 100x |
| $448 to $760 a day of downtime | "Industry research," unnamed |
| PM cuts total maintenance cost 18 to 30 percent | Unnamed "research" |
| PM downtime reduction of 30 to 50 percent | Unsourced |
How to Measure the Gap in Your Own Fleet
Tag every work order as planned or unplanned, then compare cost and downtime
Compare the same units before and after you tighten the PM schedule, and give it at least two quarters. That comparison is a measured result, which no published average can be.
See the Real Cost of Reactive Repairs in Your Fleet: Tag Planned and Unplanned Work in FleetRabbit
FleetRabbit keeps PM schedules, inspections and work orders for every vehicle in one record, so you can separate planned from unplanned work and compare cost and downtime over time. Free for up to 3 vehicles, then $5 per vehicle per month.
PM schedules and reminders
Work orders by cause
Cost per vehicle
Free for 3 vehicles
Frequently Asked Questions
Quick answers on preventive versus reactive maintenance cost
Does reactive maintenance cost 3 to 5 times more?
That claim is attributed to the Department of Energy, but the DOE guide does not say it. Its own figures give about 1.4 to 1.
What does DOE actually say?
Preventive maintenance saves an estimated 12 to 18 percent over reactive, attributed to unnamed studies, with annual costs of $18 reactive and $13 preventive per horsepower.
Is there measured evidence?
A 2020 NIST survey of manufacturers found reactive-heavy plants lost more planned time to downtime, though it is not about trucks and is described as anecdotal.
Why do fleet sources show bigger gaps?
Many count towing, downtime, rental and lost loads. Those costs are real but vary widely, so use your own.
How do I measure my own gap?
Tag work orders planned or unplanned and compare cost, downtime days and repeat causes by quarter.
Should I never run reactive?
Some reactive work is rational for low-risk, cheap items. The aim is to prevent failures that strand trucks or cost the most.
What does FleetRabbit cost?
FleetRabbit is free for up to three vehicles and $5 per vehicle per month after that.
Track 3 vehicles free.
Replace Borrowed Statistics With Your Own Planned-Versus-Unplanned Numbers
Tag your work orders, track downtime and compare quarters. That is the evidence that earns a maintenance budget.
Free tier for up to 3 vehicles · No credit card required · Work orders stored per vehicle
October 16, 2026
By Derek Goes
All Articles