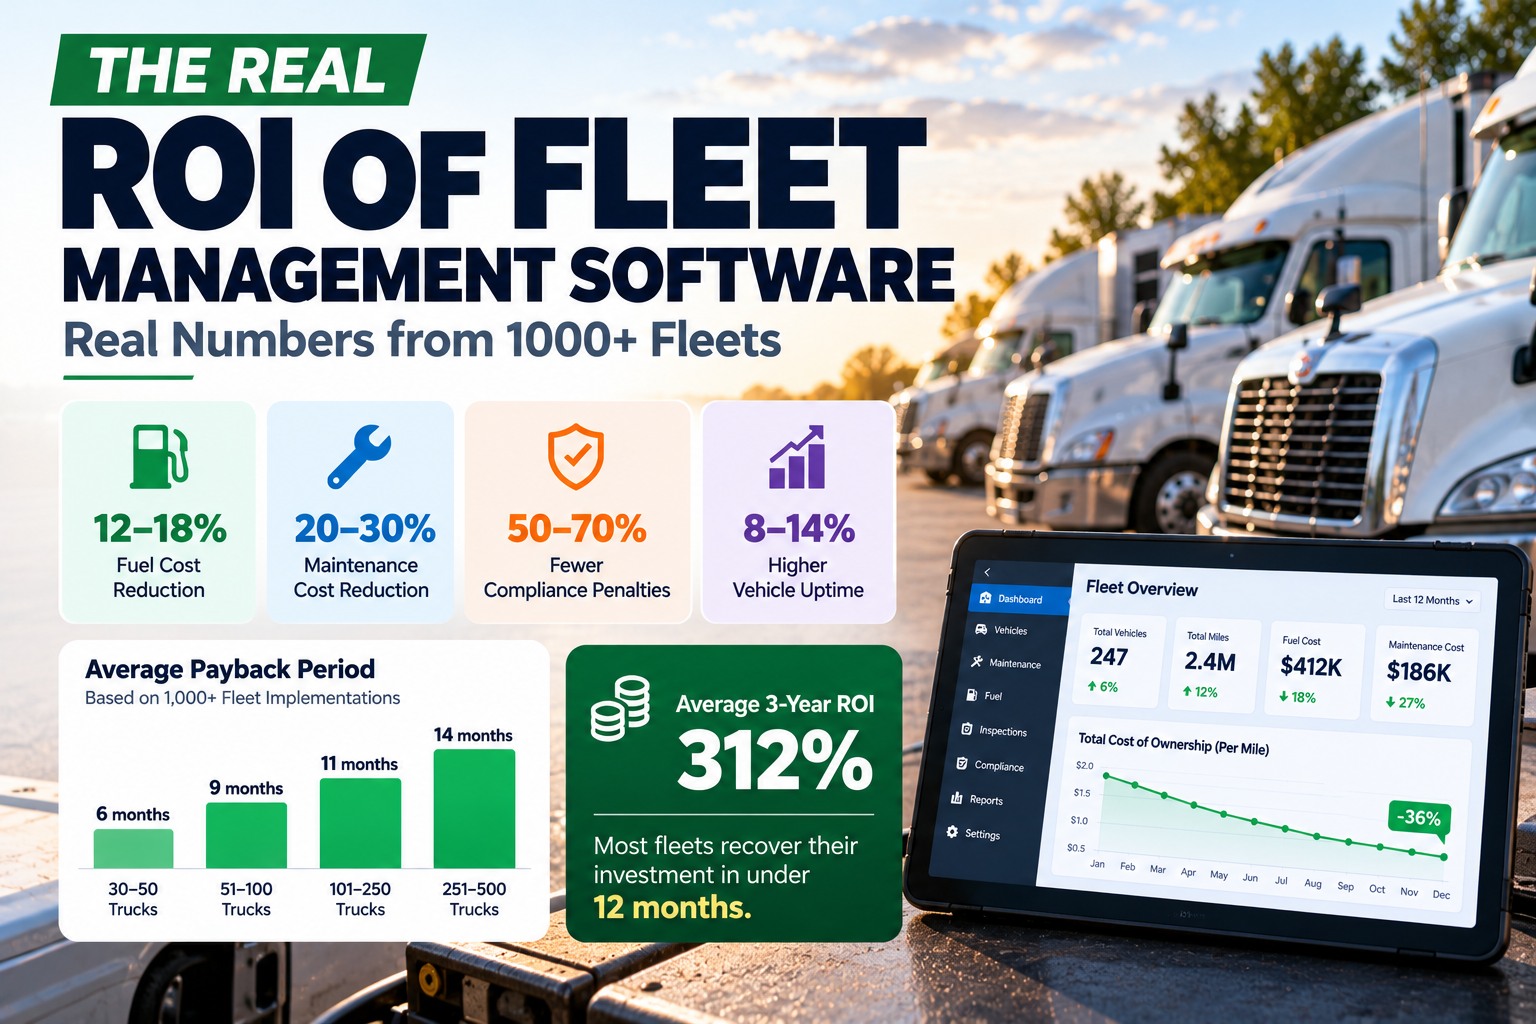
Every fleet software vendor promises a fast payback, and almost none show the arithmetic. This page does. Rather than quote savings from customers you can't check, it builds the return on fleet management software from published, independent data: fuel burned at idle from Argonne National Laboratory, repair and maintenance cost per mile from ATRI, and federal penalty amounts from the FMCSA's own schedule. The model runs the same assumptions for a 30-truck, a 100-truck and a 500-truck fleet, then halves every saving to show a conservative case. Every input is in a table you can replace with your own numbers. If you'd rather have someone run it with your real fuel, maintenance and fleet data, schedule a demo and we'll build your ROI case together.
Where fleet software savings come from: fuel, maintenance and the hours spent on paper
Fleet software doesn't save money by itself. It saves money by changing three things people do: how long trucks idle, how early defects get caught and repaired, and how much time drivers and office staff spend filling in, filing and chasing paperwork. Each one can be estimated from public data.
The assumptions behind the model, line by line
Each assumption is deliberately moderate. Swap any line for your own data and the rest of the model still holds.
| Input | Value used | Basis |
|---|---|---|
| Idle hours per truck | 1,800 a year | Argonne estimate for long-haul trucks; regional fleets idle less |
| Fuel burned at idle | 0.8 gallon an hour | Argonne National Laboratory |
| Idle reduction | 20% base, 10% conservative | Assumption for idle reporting plus driver coaching |
| Diesel price | $3.75 a gallon | Assumption; replace with your fuel card average |
| Miles per truck | 100,000 a year | Assumption for a tractor fleet |
| Repair and maintenance | 21.5 cents a mile | ATRI Operational Costs of Trucking, 2025 data |
| Maintenance reduction | 5% base, 2.5% conservative | Assumption for earlier defect repair and on-time PM |
| Admin time saved | $200 base, $100 conservative per truck | Assumption for paperwork filed, chased and retrieved |
| Software cost | $30 per truck per month, plus onboarding | Assumption; onboarding $5,000, $10,000 and $25,000 by fleet size |
Three fleets, one model: what the numbers look like at 30, 100 and 500 trucks
Savings scale with the number of trucks, while onboarding is a one-time cost that matters less as the fleet grows. That's why payback shortens slightly for larger fleets, even though the per-truck assumptions are identical.
Worked example: the 100-truck fleet, line by line
Fuel: 1,800 idle hours × 20% reduction × 0.8 gallon × $3.75 is $1,080 per truck, or $108,000 across the fleet. Maintenance: 100,000 miles × 21.5 cents is $21,500 of repair spend per truck; 5% of that is $1,075, or $107,500 for the fleet. Admin time adds $20,000 at $200 per truck. Total annual saving: $235,500. Year-one cost is $36,000 of subscription plus $10,000 onboarding, $46,000 in all. Divide $46,000 by monthly savings of about $19,600 and payback comes in at 2.3 months. Over five years, savings of $1,177,500 less $190,000 of total cost leaves a net of $987,500. Every number in that chain can be checked against the assumption table and replaced with your own.
The conservative case: halve every saving and payback still lands under six months
Good ROI models survive pessimism. Cutting idle reduction to 10%, maintenance savings to 2.5% and admin savings to $100 per truck halves the annual saving to about $1,178 per truck. The subscription cost stays the same.
The model is most sensitive to idle hours. A regional or vocational fleet that idles far less than 1,800 hours a year will see a smaller fuel line, and maintenance savings will carry more of the return. That's another reason to run the numbers with your own data.
Compliance penalties: the risk the model doesn't count
The ROI above leaves out penalties entirely, because no fleet plans to be fined. But the exposure is real, and missing or incomplete maintenance and inspection records are among the easiest violations to prove in a compliance review. These are the maximums in FMCSA's current penalty schedule, Appendix B to 49 CFR Part 386.
One avoided maintenance violation is worth more than a year's subscription for a 30-truck fleet in this model. Keeping DVIRs, repair certifications and PM records complete through a digital DVIR and DOT inspection workflow is the simplest protection.
When each saving shows up after go-live
Savings don't all arrive at once, and a business case is more credible when it says so. Admin time is the first to move: as soon as drivers file inspections on their phones, nobody is collecting, scanning or chasing paper, usually within the first month. Fuel savings follow over the next two to three months as idle reports go out and drivers are coached on them. Maintenance savings take longest, typically showing through the rest of the first year, because they come from defects caught earlier, PM done on time and fewer road calls, which only appear once a few service cycles have passed. Plan reviews at 30, 90 and 365 days and compare each against the baseline you recorded before go-live.
Returns the model leaves out on purpose
The model above counts only savings that can be estimated from public data. Several real returns are harder to price and are left out so the case stays defensible. Unplanned downtime costs more than the repair: a truck off the road misses loads, and a road call often costs more than the same repair done in the shop. A complete, documented maintenance history can support resale value when units are replaced. Clean inspection and maintenance records strengthen a fleet's position in insurance renewals and in litigation after a crash. And drivers notice when defects they report actually get fixed. Mention these as upside, but don't put numbers on them unless you have your own data.
How to judge any vendor's ROI claim, including ours
Case studies that quote big percentage savings are common in fleet software marketing. Before you rely on one, ask four questions. What was the baseline, and how was it measured before the software went in? Is the fleet comparable to yours in size, duty cycle and region? Over what period were the savings measured, and does that include seasonal effects like winter fuel economy? And what exactly was counted: fuel only, or fuel plus maintenance plus labour, net of the software cost? A vendor that can't answer those clearly is giving you a story, not a number. That's why this page shows its model and its assumptions instead.
Calculate your own fleet software ROI in four steps
Use your last 12 months of fuel card data for idle and price, your work orders for repair cost per mile, and an honest estimate of the hours your office spends on inspection and maintenance paperwork. Run it once at your expected savings and once at half, and present both.
What makes the savings real, and what makes them disappear
- Drivers use the mobile DVIR every day, not just when reminded
- Defects become work orders automatically and are closed before dispatch
- PM is scheduled by miles or hours, not remembered
- Idle and fuel reports are reviewed with drivers each month
- One person owns the numbers and reports them to leadership
- Paper and software run side by side for months
- Only managers have logins, so drivers and technicians work around it
- Reports are generated but nobody acts on them
- PM schedules are set once and never adjusted to duty cycle
- Nobody measures the baseline, so nobody can prove the change
The biggest lever in every scenario is adoption. Fuel and maintenance savings come from people changing what they do, which is why connecting inspections to preventive maintenance scheduling and repairs in one place matters more than any single feature.
FleetRabbit puts the three savings levers in one app your drivers and technicians use every day
- This ROI model, run with your fleet's numbers
- Where each saving shows up in the software
- Setting a baseline so you can prove the change
- How fast drivers and technicians get started
- Pricing for your fleet size
Once the savings start, keep them visible. FleetRabbit's fleet maintenance tools track repair cost and downtime per unit, so the return shows up in the monthly numbers rather than in a one-time business case.