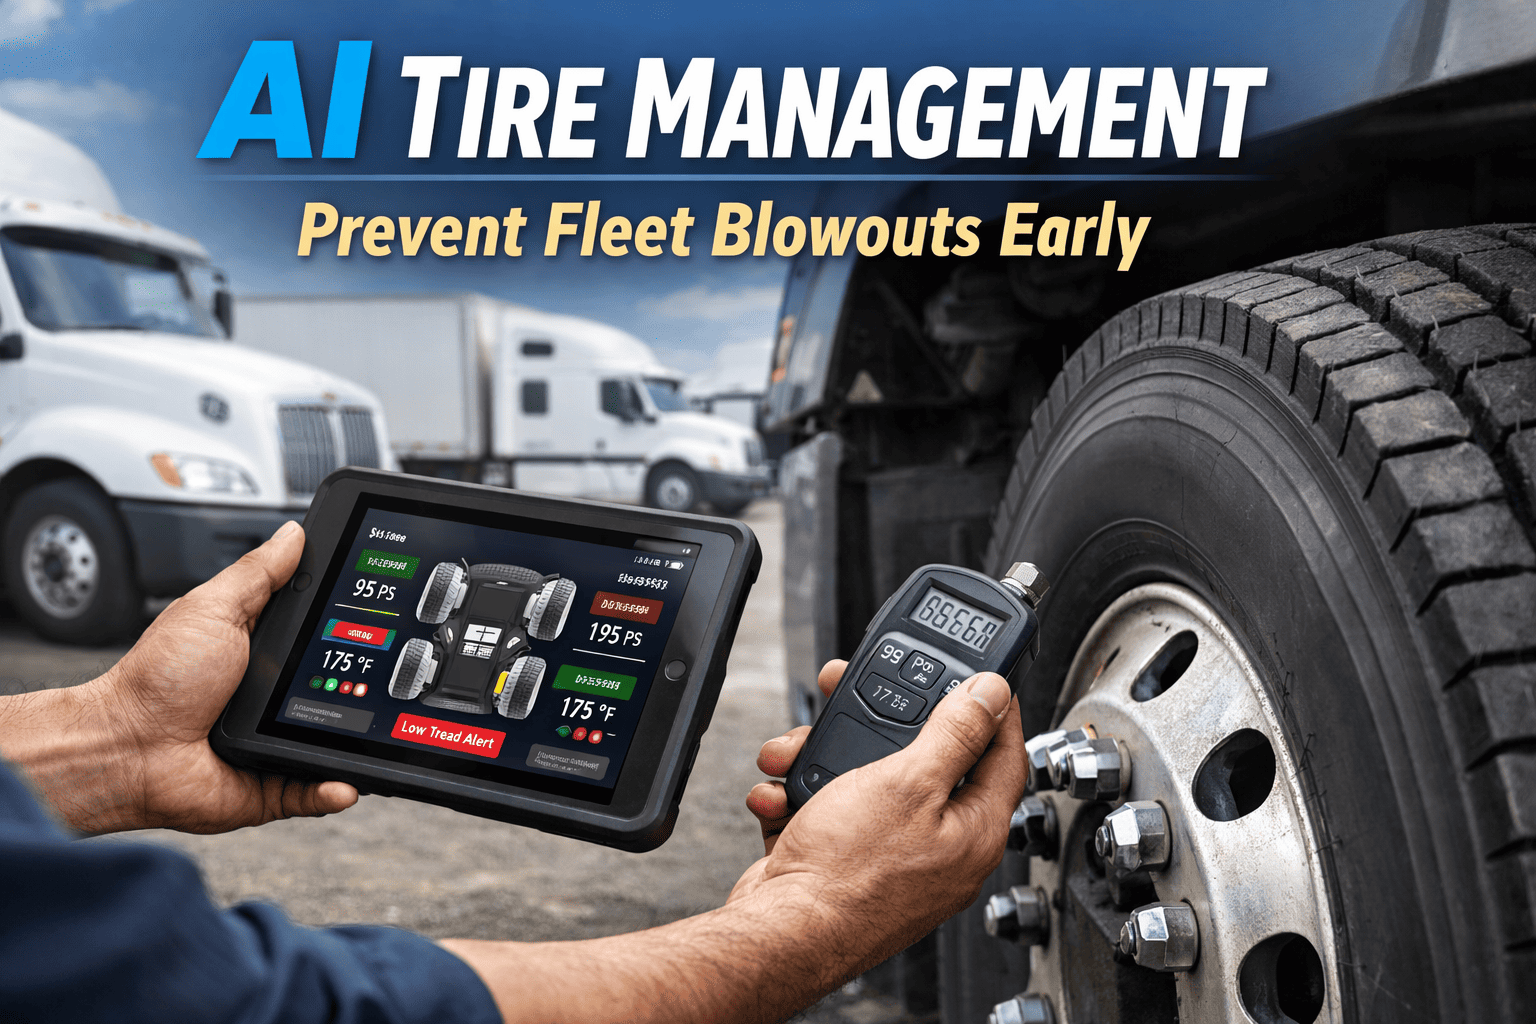
A single tire blowout costs fleets $600 average in direct expensesbut the real damage is the 4-6 hours of unplanned downtime, the missed delivery, the potential accident, and the DOT inspection that follows. Most fleet managers assume tire failures are unpredictable, but data tells a different story: 73% of tire failures show detectable warning signs 2-4 weeks before the blowout happens. The problem isn't that failures come without warning—it's that human inspections miss those warnings 60% of the time. AI tire management changes this equation completely, detecting uneven wear patterns, sidewall damage, tread depth approaching limits, and pressure anomalies at pixel-level precision that no visual inspection can match. Book a demo to see AI tire detection on your fleet, or start free with up to 3 vehicles.
The Problem with Manual Tire Inspections
Drivers check tires daily during pre-trip inspections—kicking tires, visual scan, maybe a pressure check if they have time. But these inspections miss early-stage wear patterns, internal structural damage, and gradual pressure loss that develops over days or weeks. By the time issues are visible to the naked eye, you're already in the danger zone where failure can happen any mile.
AI analyzes tire photos at pixel level, detecting 0.5mm tread depth changes and sidewall anomalies that predict failures weeks in advance. It's not replacing driver inspections—it's giving them superhuman vision to catch what eyes alone cannot see.
Why Tire Failures Are More Preventable Than You Think
The tire industry has studied failure patterns for decades, and the data is clear: most blowouts don't happen randomly. They're the end result of progressive deterioration that leaves detectable traces along the way. Understanding these patterns reveals why AI monitoring catches what human inspection misses.
Tread-Related Failures
Insufficient tread depth, uneven wear patterns, and tread separation account for over a third of all tire failures. These issues develop gradually over thousands of miles, leaving clear visual evidence that AI detects weeks before failure threshold.
- Center wear indicates chronic overinflation
- Edge wear signals underinflation or alignment issues
- One-sided wear points to camber misalignment
- Cupping/scalloping reveals suspension problems
AI tracks wear rate across multiple tread points, predicting exactly when each tire will reach minimum depth—not based on mileage estimates, but actual measured wear progression.
Sidewall Damage
Sidewall failures are the most dangerous because they're sudden and catastrophic. Unlike tread wear which is gradual, a compromised sidewall can blow at highway speed without warning. But the damage that causes these failures—bulges, cuts, impact marks, weather cracking—is visible before failure if you know what to look for.
- Bulges indicate internal belt separation
- Cuts expose structural cords to moisture and contamination
- Impact marks from potholes weaken internal structure
- Weather cracking from UV/ozone degrades rubber compound
AI scans entire sidewall surface, flagging anomalies as small as 5mm that drivers routinely miss during walk-around inspections. Schedule a demo to see sidewall detection in action.
Punctures and Foreign Objects
Nails, screws, glass, and road debris cause slow leaks that lead to underinflation failures or sudden blowouts when the object finally works loose. These objects can be embedded in tread for days or weeks before causing problems—plenty of time to catch them if inspection is thorough enough.
- Objects as small as 2mm can cause slow leaks
- Embedded objects often invisible during quick visual scan
- Slow leaks lead to underinflation damage before going flat
- Removal while object is in place allows simple plug repair
AI pattern analysis detects objects embedded in tread that visual inspection misses 91% of the time. Early detection means a $15 plug repair instead of a $400 roadside tire replacement.
Age and Environmental Degradation
Tires degrade over time regardless of mileage. UV exposure, ozone, temperature cycling, and simple chemical aging weaken rubber compounds and reduce structural integrity. A tire with plenty of tread depth can still be dangerous if it's too old or has been exposed to harsh conditions.
- Rubber compounds degrade after 5-6 years regardless of use
- UV exposure accelerates surface cracking
- Ozone causes sidewall weathering
- Temperature extremes stress internal structure
AI assesses aging indicators—surface texture changes, micro-cracking patterns, rubber discoloration—that indicate a tire is approaching end of safe service life even when tread depth looks acceptable.
What AI Detects That Human Inspections Miss
AI tire analysis examines every photo at 4,000+ data points per tire, identifying patterns invisible to visual inspection. Here's exactly what predictive tire monitoring catches before it becomes a blowout—and why human eyes alone can't match this capability. Start free to test on your fleet.
Early Tread Wear Patterns
AI measures tread depth at 12+ points per tire and tracks wear rate over time. It detects center wear (overinflation), edge wear (underinflation), one-sided wear (alignment), and cupping (suspension issues) at 0.5mm precision—changes too subtle to see but significant enough to predict failure timing.
Sidewall Damage Detection
Bulges, cuts, cracks, scuffs, and impact damage on sidewalls indicate internal structural compromise. These failures are sudden and catastrophic—but the visible damage precedes failure by days or weeks. AI flags sidewall anomalies as small as 5mm that drivers walk past every day.
Irregular Wear Signatures
Feathering, scalloping, heel-toe wear, and diagonal wear patterns indicate mechanical problems—misalignment, worn suspension components, improper tire rotation, or brake issues. AI identifies the root cause pattern, not just the symptom, enabling targeted repairs that prevent recurrence.
Foreign Object Detection
Nails, screws, glass, and debris embedded in tread cause slow leaks that lead to underinflation damage or sudden flats. AI detects objects as small as 2mm that visual inspection misses—catching them while they can still be repaired with a simple plug instead of emergency tire replacement.
Precise Tread Depth Measurement
Unlike the standard 3-point depth check, AI measures tread across the entire tire surface—inside edge, center, outside edge, and multiple points between. This comprehensive measurement reveals uneven wear that single-point checks miss and predicts exactly when each tire will reach replacement threshold.
Aging and Weather Cracking
UV damage, ozone cracking, and age-related deterioration weaken rubber compound even when tread depth looks fine. AI assesses surface texture, micro-cracking patterns, and discoloration that indicate a tire is approaching end of safe service life—critical for trailers and spare tires that age faster than they wear.
See AI Tire Detection in Action
Upload a photo of any fleet tire and watch AI analyze tread depth, wear patterns, sidewall condition, and damage indicators in seconds. Get actionable recommendations before minor issues become roadside emergencies.
How AI Tire Monitoring Works
Drivers capture tire photos during regular DVIR inspections—no extra steps, no special equipment, no training beyond "photograph each tire." AI processes each image through a multi-stage analysis pipeline that takes under 3 seconds per tire:
Photo Capture
Driver photographs each tire during pre-trip inspection using their smartphone. The app guides optimal angle (perpendicular to tread face) and distance (2-3 feet) for best analysis results. Works with any modern smartphone camera—no special equipment needed.
Image Enhancement
AI corrects for lighting variations (shadows, glare, low light), adjusts contrast to reveal tread detail, and normalizes perspective distortion. This preprocessing ensures consistent analysis quality regardless of photo conditions—bright sun, shade, indoor bays, or overcast weather.
Multi-Point Analysis
Computer vision scans 4,000+ data points per tire image: tread depth at 12+ locations, wear pattern geometry across the entire surface, sidewall condition from bead to shoulder, and surface anomaly detection for embedded objects or damage.
Historical Comparison
AI compares current scan against previous inspections of the same tire, tracking wear rate progression and detecting accelerating deterioration. A tire wearing 1mm/month that suddenly jumps to 2mm/month signals a developing problem even if absolute depth is still acceptable.
Risk Assessment
Algorithm calculates failure probability based on current condition, wear trajectory, damage severity, and historical data from millions of tire inspections. Risk score translates complex analysis into simple priority: Critical (immediate action), Warning (schedule service), or Monitor (track progression).
Alert and Action
Critical issues trigger immediate alerts to driver and fleet manager. Warning items auto-schedule service appointments. All findings flow to work orders with tire position, issue description, photos, and recommended action—maintenance sees exactly what needs attention without hunting for information.
The Real Cost of Tire Failures vs. Prevention
Every blowout that doesn't happen is money saved—in direct costs, downtime, delivery penalties, and secondary damage. The math overwhelmingly favors prevention, but most fleets don't see the full picture until they add up all the hidden costs of reactive tire management.
The average fleet experiences 2-3 tire-related incidents per 100 vehicles annually with reactive management. With AI predictive monitoring, that drops to 0.2-0.3 incidents—an 89% reduction. For a 50-vehicle fleet, that's avoiding 1-2 major incidents per year, saving $4,500-$33,400 in direct costs alone, plus the operational disruption you can't put a price on.
Real Detection Examples from Fleet Operations
Theory is useful, but real examples show what AI tire monitoring actually catches in daily fleet operations. These are actual detections from fleets using AI tire analysis:
Sidewall Bubble Detected - Blowout Imminent
During routine morning DVIR, AI flagged a 12mm sidewall bulge on position 4 (left rear outer) of a trailer. The driver had walked past this tire for 3 days without noticing. Internal belt separation was causing the bulge—this tire was days or even hours from catastrophic failure at highway speed.
The trailer was immediately taken out of service. Inspection confirmed internal damage; tire was replaced during scheduled shop time. Total cost: $380 for planned replacement.
Accelerating Inside Edge Wear - Alignment Issue
AI detected that inside edge wear rate on steer tires increased 40% over a 3-week period. Tread depth was still acceptable (5.2mm), but the acceleration pattern indicated a developing alignment problem. Left unchecked, the tires would need replacement in 6 weeks instead of the expected 14 weeks.
Alignment check revealed toe-out condition from a pothole impact. Alignment corrected for $85, wear rate returned to normal, and the steer tires lasted their full expected lifecycle.
Embedded Screw in Drive Tire
AI pattern analysis detected a 3mm screw head embedded in the tread of a drive tire. The driver hadn't noticed during visual inspection—the screw was between tread blocks and nearly flush with the surface. The tire was still holding pressure, but the slow leak would have caused underinflation damage within days.
Tire was pulled and plugged during the next scheduled stop. Repair cost: $18. The tire continued in service for another 40,000 miles.
Cupping Pattern Developing - Suspension Issue
Early-stage cupping detected on drive axle tires—slight scalloped wear pattern just beginning to develop. This wear signature indicates worn shock absorbers allowing the tire to bounce rather than maintain consistent contact with the road.
Suspension inspection confirmed shocks were at end of life. Replacement scheduled during next PM service. Early detection meant the cupping hadn't progressed far enough to require tire replacement—just shock service.
Catch Tire Issues Before They Catch You
Join fleets that reduced roadside tire failures by 89% with AI predictive monitoring. No hardware to install, no sensors to maintain—just smartphone photos during regular inspections and predictive analytics that see what human eyes miss.
Integration with Fleet Operations
AI tire monitoring isn't a standalone system you have to manage separately—it connects directly to your existing workflows, making tire data part of your normal fleet operations:
DVIR Integration
Tire photos captured during daily driver vehicle inspection reports. Drivers already walk around the vehicle—they just add quick photos at each wheel position. AI analysis happens automatically in the background while the driver completes other inspection items. No extra app, no separate workflow.
Work Order Automation
Critical and warning findings auto-generate work orders with complete details: tire position, issue type, severity, photos, measurement data, and recommended action. Maintenance technicians see exactly what needs attention without playing phone tag with drivers or hunting for information.
Parts Inventory Connection
When replacement is needed, AI identifies tire specifications (size, load rating, speed rating) and checks parts inventory for matching stock. Shows current availability or triggers reorder before the tire is actually needed—no more emergency tire runs.
Preventive Maintenance Data
Tire wear data feeds into PM schedules—rotation intervals based on actual wear patterns, alignment checks triggered by uneven wear detection, and replacement forecasting based on measured wear rates rather than generic mileage estimates.
AI vs. TPMS: Different Tools for Different Problems
Some fleets wonder if their existing tire pressure monitoring systems (TPMS) make AI tire monitoring redundant. They're actually complementary tools that catch different types of problems:
TPMS catches pressure problems in real-time—valuable for sudden leaks and temperature-related pressure changes. AI catches everything else: the 73% of tire failures that aren't pressure-related but are visually detectable before failure. Best practice is using both together for comprehensive tire health monitoring.
Getting Started with AI Tire Monitoring
No sensors to install, no hardware to buy, no IT project to manage. AI tire monitoring works with equipment your drivers already have in their pockets:
Enable Tire Module
Activate AI tire analysis in your FleetRabbit account settings. Takes 2 minutes—just toggle on tire monitoring and configure which vehicle groups to include.
Configure Alert Thresholds
Set your preferences for Critical (immediate action required), Warning (schedule service within X days), and Monitor (track but no action) alerts. Customize by vehicle type or fleet segment if needed.
Brief Drivers (5 minutes)
Show drivers how to capture tire photos during DVIR. The app guides them through optimal angles—perpendicular to tread face, 2-3 feet distance. Most drivers get it immediately; it's just taking pictures.
Build Baseline and Monitor
AI begins building baseline condition data for each tire from day one. Predictive accuracy improves with each inspection as the system learns wear rates and patterns specific to your fleet's operating conditions.
Most fleets are fully operational with AI tire monitoring within one day of activation. There's no learning curve beyond "take photos of tires"—the AI handles all the analysis complexity behind the scenes.
Frequently Asked Questions
AI detects tread depth changes at 0.5mm precision and identifies wear patterns with 94% accuracy. For comparison, trained technicians using depth gauges achieve similar precision on single-point measurements, but they miss 60% of irregular wear patterns that AI catches through comprehensive surface analysis. AI also measures 12+ points per tire versus the typical 3-point manual check.
No special equipment needed. AI tire monitoring works with standard smartphone cameras—iPhone 8 or newer, any Android device from 2018 forward. The app guides drivers to capture photos at optimal angle and distance during regular DVIR inspections. If your drivers have smartphones, you have everything you need.
They're complementary, not competing. TPMS monitors pressure in real-time—great for sudden leaks and temperature changes. AI vision detects everything pressure sensors can't: wear patterns, sidewall damage, embedded objects, aging, and tread depth. Since 73% of tire failures aren't pressure-related, you need both for complete coverage. AI requires no hardware installation or sensor maintenance.
On average, AI detects warning signs 34 days before failure for wear-related issues. Sidewall damage and embedded objects are flagged immediately when photographed. The system tracks wear rate trends over time to predict replacement windows weeks in advance—not based on mileage estimates, but actual measured wear progression on each specific tire.
About 30-45 seconds per vehicle to photograph all tires. Most fleets integrate tire photos into existing DVIR workflow—drivers are already walking around the vehicle checking lights, leaks, and damage. They just add quick photos at each wheel position. The app makes it simple: point, tap, move to next tire.
Critical alerts go to fleet manager and driver immediately via app notification, SMS, and email. The tire is flagged as potentially unsafe for operation until inspected by maintenance. A work order auto-generates with complete details: issue type, tire position, severity assessment, photos, and recommended action. The vehicle shows as flagged in dispatch until the issue is resolved.
Stop Blowouts Before They Start
AI tire monitoring detects 73% of failures weeks before they happen—no hardware to install, no sensors to maintain, just smartphone photos and predictive analytics that see what human eyes miss. Free for up to 3 vehicles, then $3/vehicle/month.