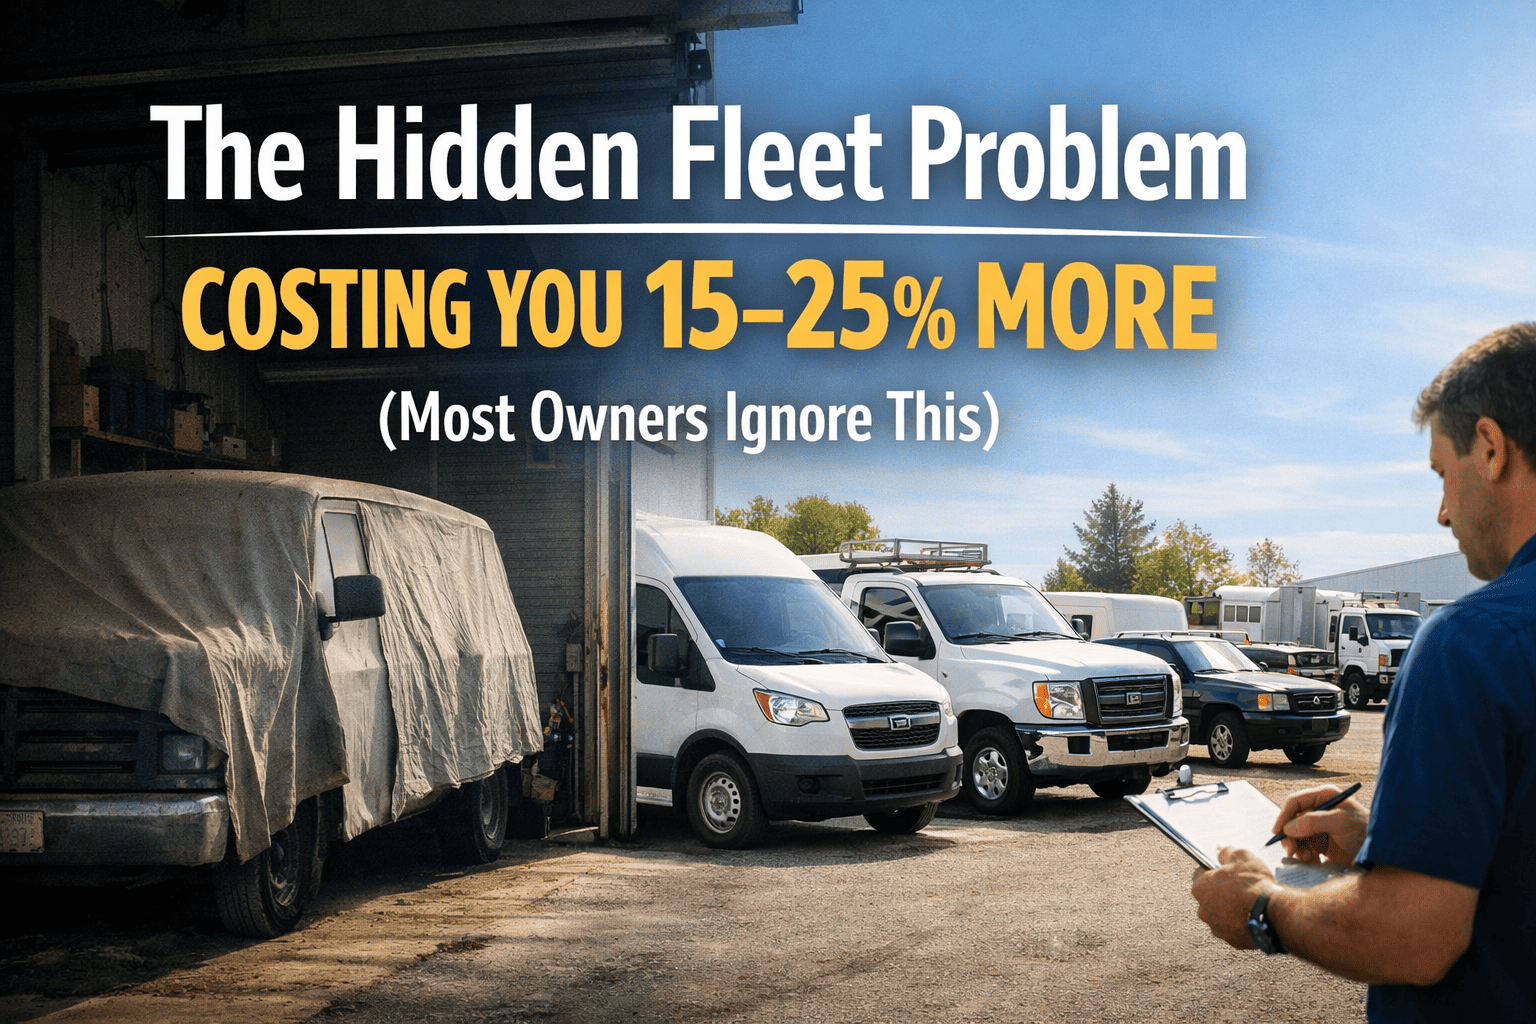
Something is draining your fleet budget. You've checked the obvious suspects—fuel prices, repair shops, insurance rates. But the costs keep climbing. The real culprit? It's hiding in plain sight, disguised as normal operations, stealing 15-25% of your budget every single month. Time to investigate.
The Hidden Fleet Problem
Why Your Costs Keep Rising When Nothing Seems Wrong
The Evidence: What's Really Happening
We investigated thousands of fleet operations. The pattern is always the sameowners track obvious costs while hidden drains steal their profits. Here's the evidence we found, organized by severity.
Fuel Theft & Fraud
Excessive Idle Time
Route Inefficiency
Wrong Maintenance Timing
What You Think You See
- ✓ Normal fuel expenses
- ✓ Regular repair costs
- ✓ Standard driver hours
- ✓ Expected mileage
- ✓ Routine maintenance
What's Really There
- ! 6% fuel theft hidden inside
- ! 60% preventable breakdowns
- ! 30+ min daily idle time
- ! 15-25% unnecessary miles
- ! Wrong timing = failures
Want to See What's Hidden in YOUR Fleet?
Free 15-minute investigation reveals exactly where your money disappears. No commitment—just answers.
Witness Statement
Here's what one fleet owner discovered after investigating their hidden problem. This story repeats across thousands of fleets—the only variable is when owners decide to look.
I ran the numbers twice because I didn't believe it. We were losing $8,100 every month to problems I couldn't see. One driver was filling his boat twice a week on our card—$400/month right there. Trucks idled 45 minutes a day on average. Routes had 22% extra miles baked in. FleetRabbit showed me all of it in the first 5 days.
The Investigation Process
Finding hidden problems isn't complicated—it just requires the right tools. Here's exactly how fleets expose and eliminate their invisible losses. Learn more about how AI uncovers fleet problems that manual tracking misses.
Deploy Real-Time Tracking
GPS monitoring reveals actual vehicle behavior—where they go, how long they idle, what routes they take.
AI Pattern Detection
Machine learning spots anomalies humans miss: unusual fuel purchases, route deviations, maintenance patterns.
Eliminate & Recover
Route optimization, maintenance scheduling, driver coaching—turn findings into 20-30% cost reduction.
Case Closed: What Recovery Looks Like
These are documented results from fleets that completed the investigation. See how to calculate your potential recovery before starting.
Why FleetRabbit Finds What Others Miss
Most tracking shows location. FleetRabbit shows problems—the invisible ones costing you 15-25%. Discover how AI catches fuel theft that looks like normal usage.
Full surveillance. All features. No tiers. Competitors charge $25-50.
30-Minute Setup
No hardware. No IT. Import data and start finding problems today.
Free for 3 Vehicles
Test the investigation on your fleet before committing anything.
No Contracts
Month-to-month. Stay because it works, not because you're locked in.
Frequently Asked Questions
If your costs keep rising without clear explanation, you have one. Specifically: fuel expenses increasing when prices don't, "random" breakdowns, drivers busy but productivity flat. The only way to confirm is getting visibility into real-time data—which is exactly what we provide free for 3 vehicles.
Most fleets identify major issues within the first week. Fuel anomalies, idle patterns, and route inefficiencies show up immediately. Full investigation with all hidden costs mapped typically takes 30 days. But you'll see actionable findings from day one.
Small fleets often have bigger hidden problems—less visibility means more goes unnoticed. At $3/vehicle/month (free for 3 vehicles), even a 5-truck operation saving one gallon daily per vehicle recovers 10x the software cost. Small doesn't mean the problem is small.
Regular GPS shows where vehicles are. FleetRabbit investigates why costs are high. We combine tracking with AI anomaly detection, fuel monitoring, predictive maintenance, and route optimization. It's the difference between watching your fleet and understanding it.
Ready to Open Your Investigation?
Your fleet has a hidden problem. Every day without investigation is another day of preventable losses. Free 15-minute session reveals exactly what's costing you—and how to recover it.
Free for 3 vehicles • $3/vehicle after • No contracts • Results in days






