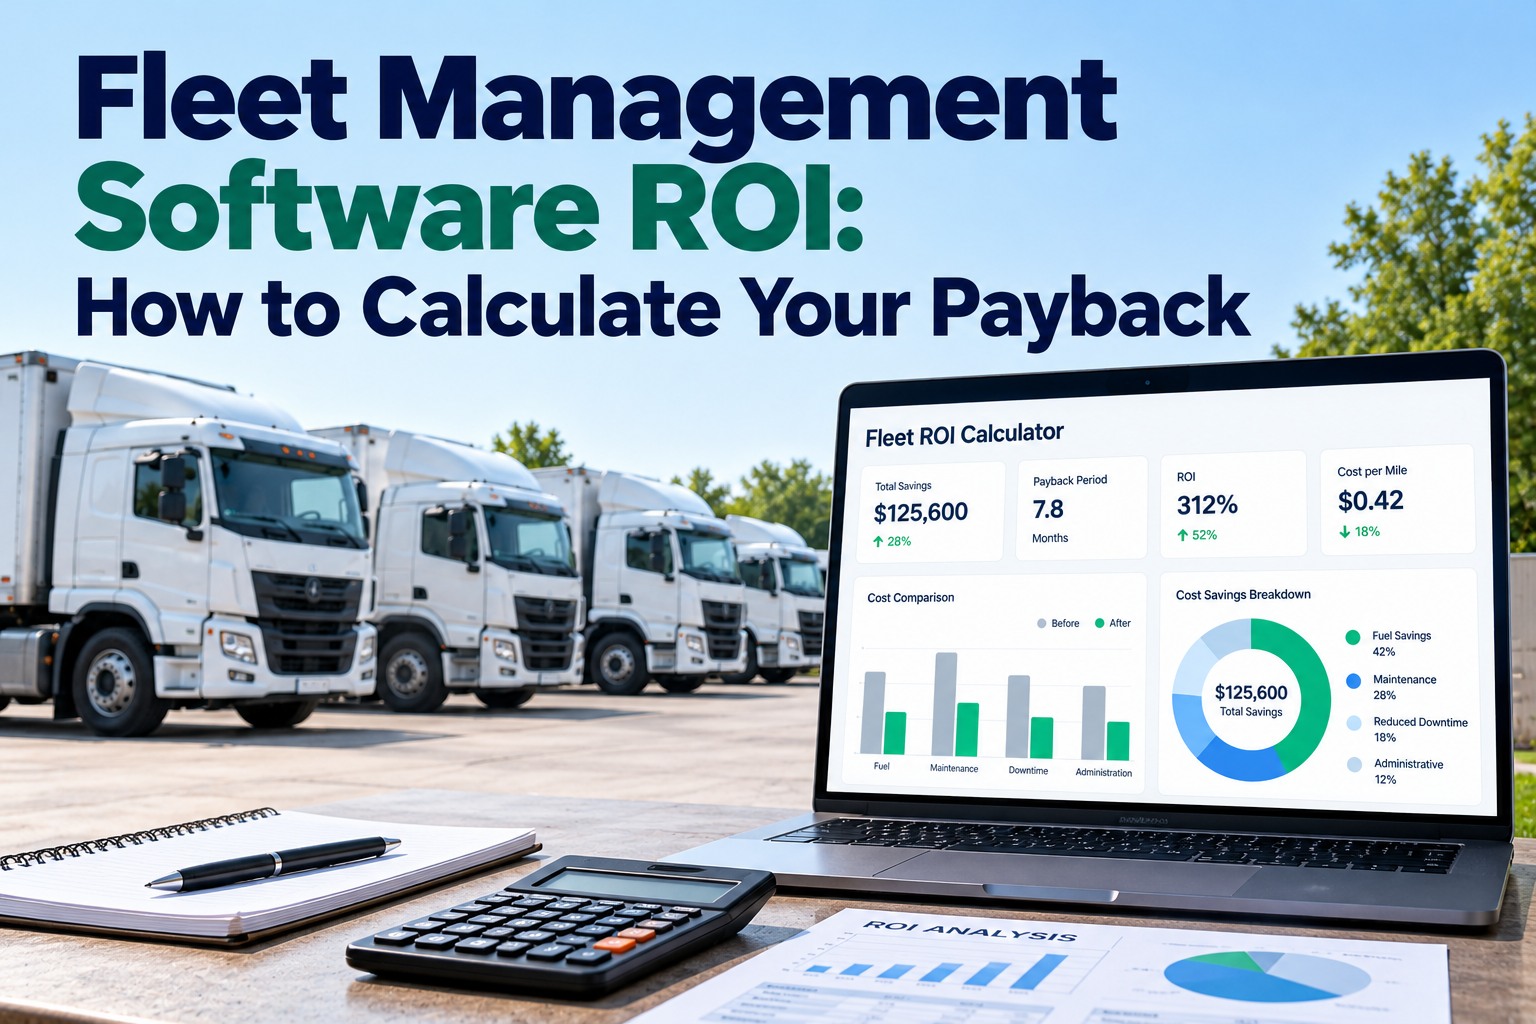
ROI calculators convert 3-5x higher than static content pagesand for good reason. Fleet managers need to justify technology investments with hard numbers, not promises. Before committing budget to fleet management software, decision-makers want concrete answers: How much will we actually save? How fast will we see payback? What's the real financial impact on our operation? This fleet management ROI calculator helps you input your actual fleet data—vehicles, fuel spend, maintenance costs, downtime hours—and get instant savings projections with realistic payback periods. Whether you're building a business case for leadership, comparing vendors, or simply validating that fleet software makes financial sense for your operation, calculating your specific ROI is the critical first step. Start your free trial and see real savings, or schedule a personalized ROI analysis.
Fleet Management ROI Calculator
Calculate your savings, payback period, and annual return on fleet management software investment.
How the Fleet Management ROI Calculator Works
Our fleet management ROI calculator uses industry-validated savings percentages based on real fleet implementations to project your specific financial impact. By inputting your current fleet metrics, you receive customized projections rather than generic estimates.
Key Variables in ROI Calculation
Fleet Size
Number of vehicles determines scale of savings. Larger fleets see higher absolute returns, but even small fleets achieve strong ROI percentages.
Monthly Fuel Spend
Fuel is typically the largest variable cost. Route optimization and driver behavior improvements typically reduce fuel consumption 8-15%.
Annual Maintenance Costs
Preventive maintenance scheduling reduces emergency repairs. Fleets typically see 20-30% maintenance cost reduction through proactive management.
Downtime Hours
Every hour a vehicle sits costs money. Predictive maintenance and faster repairs reduce downtime 25-40%, keeping vehicles earning revenue.
Driver Behavior
Harsh driving increases fuel consumption and accidents. Driver coaching typically reduces fuel waste 5-10% and accidents 40-60%.
Administrative Hours
Manual tracking, paperwork, and coordination consume staff time. Automation typically reduces administrative burden 30-50%.
Get Your Custom ROI Analysis
Our fleet experts will analyze your specific operation and provide a detailed savings projection with implementation recommendations.
How to Calculate Fleet Software ROI: Step-by-Step
Calculating fleet management investment return follows a straightforward process. Use this methodology to build your business case or validate vendor claims.
Gather Current Cost Data
Collect your baseline metrics: monthly fuel spend, annual maintenance costs, average downtime per vehicle, accident/incident costs, and administrative labor hours dedicated to fleet management.
Apply Industry Savings Percentages
Use conservative estimates based on documented fleet implementations:
- Fuel savings: 8-15% (use 10% for conservative estimate)
- Maintenance reduction: 20-30% (use 25%)
- Downtime reduction: 25-40% (use 30%)
- Accident cost reduction: 40-60% (use 45%)
- Administrative time savings: 30-50% (use 35%)
Calculate Annual Savings
Multiply each cost category by its expected savings percentage, then sum for total annual savings.
Determine Software Investment
Calculate total annual cost of fleet management software including subscription fees, hardware (if required), implementation, and training.
Calculate ROI and Payback Period
Key Areas Where Fleet Software Saves Money
Fleet management software generates savings across multiple operational categories. Understanding each area helps you identify where your fleet has the greatest improvement potential.
Fuel Optimization
Route optimization reduces miles driven. Real-time traffic avoidance prevents fuel-wasting delays. Driver behavior monitoring eliminates excessive idling, harsh acceleration, and speeding. Fuel card integration catches fraud and unauthorized purchases.
Preventive Maintenance
Automated maintenance scheduling ensures timely service. Predictive alerts catch problems before failures. Extended component life through proper maintenance intervals. Reduced emergency repair premium costs.
Reduced Downtime
Preventive maintenance prevents unexpected breakdowns. Faster diagnosis accelerates repairs. Better parts availability through planning. Increased revenue from higher vehicle availability.
Driver Safety Improvements
Real-time coaching prevents risky behavior. Dashcam evidence protects against fraudulent claims. Lower accident rates reduce insurance premiums. Reduced vehicle damage and repair costs.
Administrative Automation
Automated reporting eliminates manual data compilation. Digital inspections replace paper forms. Integrated systems reduce duplicate data entry. Exception-based management focuses attention where needed.
Example ROI Scenario: 50-Vehicle Fleet
Let's walk through a realistic fleet management business case for a mid-size operation to demonstrate how fleet ROI calculation works in practice.
Fleet Profile
Annual Savings Calculation
ROI Analysis
Payback Period for Fleet Management Software
The fleet software payback period varies based on fleet size, current operational efficiency, and software costs. However, most fleets achieve positive ROI faster than expected.
| Fleet Size | Typical Monthly Software Cost | Expected Monthly Savings | Payback Period |
|---|---|---|---|
| 10-25 vehicles | $300-750 | $2,000-6,000 | 2-4 months |
| 26-50 vehicles | $750-1,500 | $6,000-15,000 | 1-3 months |
| 51-100 vehicles | $1,500-3,000 | $15,000-35,000 | 3-6 weeks |
| 100+ vehicles | $3,000+ | $35,000+ | 2-4 weeks |
These payback periods assume implementation of core features: GPS tracking, route optimization, maintenance scheduling, and driver monitoring. Fleets that also implement fuel card integration and advanced analytics typically see even faster payback.
Why ROI Calculators Help Fleet Buyers Make Decisions
Fleet management value calculators serve a critical role in the buying process, transforming abstract benefits into concrete financial projections.
Builds Business Case
Concrete numbers convince stakeholders. CFOs and executives respond to ROI projections, not feature lists. A fleet savings calculator provides the financial justification leadership needs.
Enables Comparison
Comparing vendors on features is difficult. Comparing projected ROI is straightforward. Calculate expected returns for each option to make objective decisions.
Sets Expectations
Understanding expected savings creates accountability. Both buyer and vendor know what success looks like. Post-implementation, compare actual results to projections.
Prioritizes Features
ROI analysis reveals which capabilities matter most for your operation. Focus implementation on highest-impact features rather than trying to deploy everything at once.
Calculate Your Fleet's ROI Today
Get a personalized savings analysis for your fleet. Our experts will help you build a business case with realistic projections based on your specific operation.
Frequently Asked Questions
What's a realistic ROI expectation for fleet management software?
Most fleets achieve 200-500% ROI in the first year, with some high-performing implementations exceeding 800%. The key variables are current operational efficiency (less efficient fleets see larger improvements), fleet size (larger fleets have more savings opportunities), and implementation thoroughness (using all features generates more savings). Conservative projections typically use 10% fuel savings, 25% maintenance reduction, and 30% downtime improvement.
How long does it take to see fleet software payback?
The typical fleet software payback period ranges from 2-8 weeks for most commercial fleets. Fuel savings appear immediately through route optimization. Maintenance savings accumulate over 3-6 months as preventive scheduling takes effect. Safety improvements show within 30-60 days as driver behavior changes. Most fleets see positive monthly ROI within 60 days of full implementation.
Which fleet size benefits most from fleet management software?
Every fleet size benefits, but the financial impact scales differently. Small fleets (5-15 vehicles) see percentage returns similar to large fleets but lower absolute dollars. Medium fleets (25-100 vehicles) often see the highest ROI because they have significant savings potential but haven't yet invested in dedicated fleet staff. Large fleets (100+ vehicles) achieve massive absolute savings even with lower percentage improvements due to scale.
What costs should I include in fleet ROI calculations?
Include all direct fleet costs: fuel, maintenance, insurance, accidents/incidents, vehicle depreciation, and administrative labor. Don't forget indirect costs: customer impact of late deliveries, opportunity cost of vehicle downtime, and compliance violation risks. On the software side, include subscription fees, hardware costs (if any), implementation/training, and ongoing support. Calculate ROI using total cost of ownership.
How do I validate vendor ROI claims?
Ask for case studies from fleets similar to yours—same industry, similar size, comparable use case. Request references you can contact directly. Start with a pilot program to validate savings before full deployment. Use conservative estimates (80% of claimed savings) in your business case. Track actual results post-implementation and compare to projections.
What if my fleet is already well-managed?
Even efficient fleets find improvement opportunities. AI-powered optimization often discovers savings that experienced managers miss. Benchmark your metrics against industry standards—if you're not at top-quartile performance, software can help close the gap. Focus ROI projections on areas with largest gaps. Well-managed fleets may see 5-8% fuel savings instead of 12-15%, but ROI is typically still positive within months.