Maintaining high-performance refrigerated fleet assets across commercial grocery distribution, pharmaceutical supply chains, and perishable beverage corridors requires strict data discipline. Managing a multi-temperature reefer fleet differs fundamentally from dry-van maintenance: a single auxiliary diesel engine seizure, compressor seal failure, or refrigerant leak can destroy tens of thousands of dollars in high-value temperature-sensitive cargo in minutes. To achieve operational resilience and satisfy stringent customer temperature audit standards, fleet maintenance managers, operations vice presidents, and maintenance shop superintendents must track clear, quantitative maintenance key performance indicators (KPIs). When refrigerated carriers rely on reactive repairs, unmonitored transport refrigeration unit (TRU) engine hours, and fragmented garage greaseboards, fleets suffer from excessive roadside service calls, poor preventative maintenance (PM) compliance, and soaring cost-per-mile metrics. Deploying purpose-built cold chain fleet maintenance software unifies CAN-bus telematics, microprocessor fault code triage, digital driver pre-trip walkarounds (eDVIR), and automated shop work order scheduling. To discover how our platform streamlines reefer shop performance and lowers maintenance overhead, book an executive evaluation demo with our maintenance engineering specialists or begin tracking your reefer fleet health immediately through our free platform sign up.
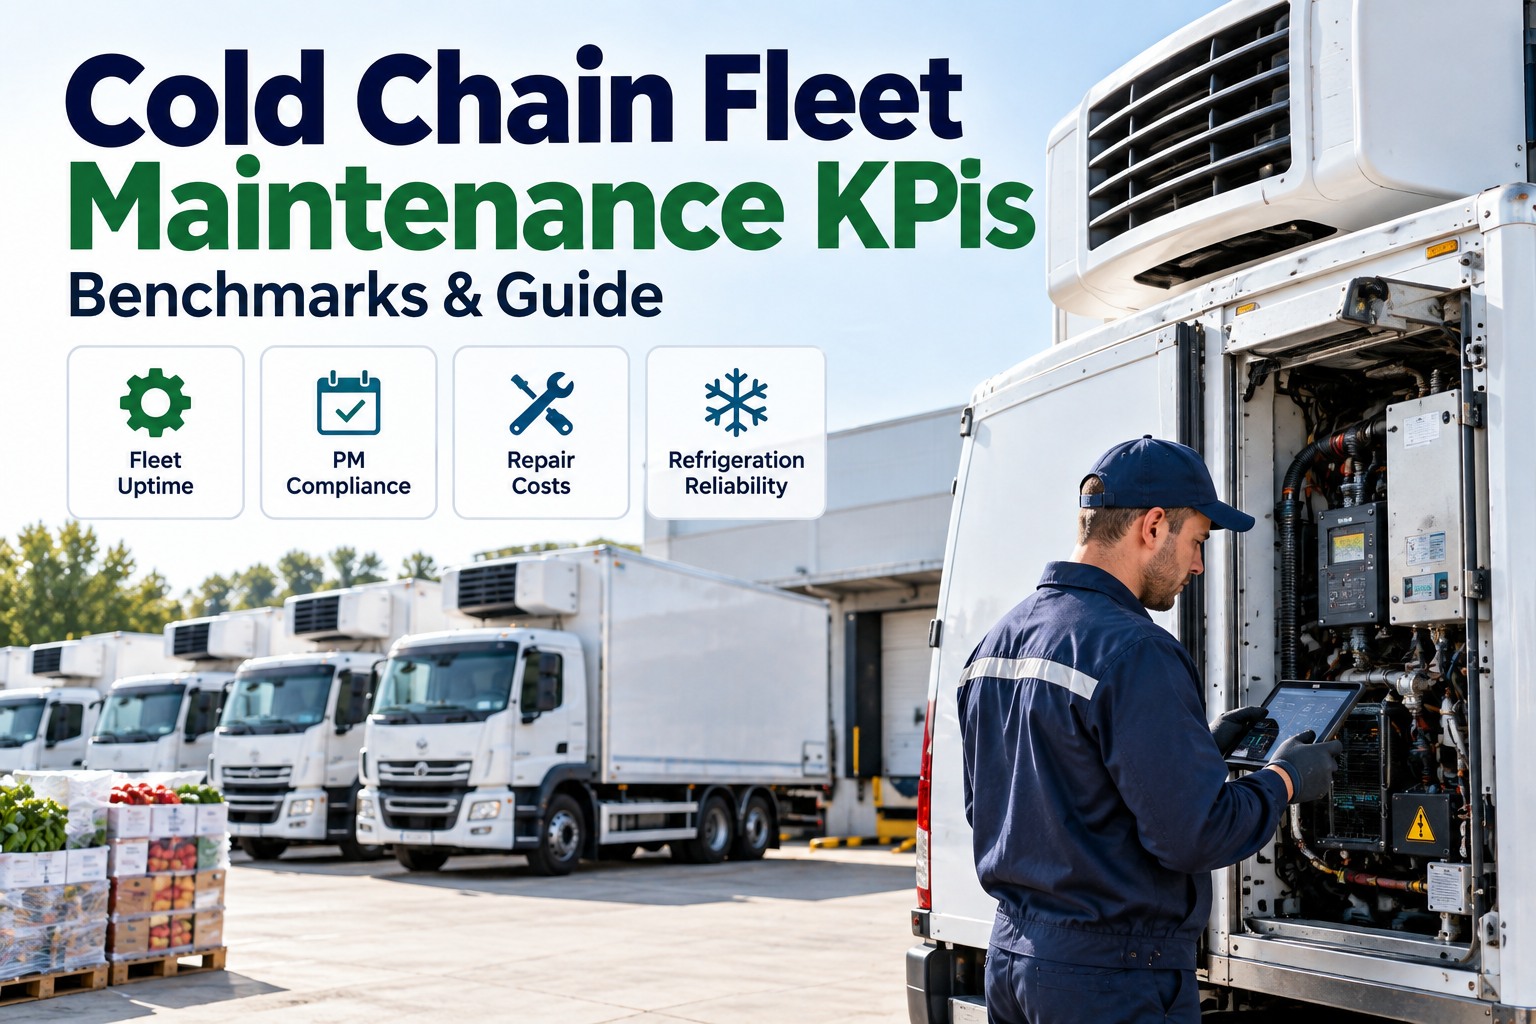
Cold Chain Fleet Maintenance KPIs: Benchmarks & Guide
A definitive operational handbook for refrigerated fleet maintenance executives. Compare empirical industry benchmarks, track TRU engine-hour thresholds, measure preventative maintenance compliance, and optimize your maintenance ratio to prevent roadside breakdowns.
Upgrade Your Cold Chain Maintenance Operations to Industry-Leading Benchmarks
Empower your fleet shop with automated TRU engine-hour triggers, predictive diagnostic trouble code triage, digital parts room inventory management, and real-time technician work orders starting from $3/vehicle/month with no hardware lock-in.
Core Maintenance KPIs for High-Performance Cold Chain Fleets
Tracking the health of a refrigerated transport operation requires maintenance metrics that go far beyond standard dry-freight chassis and tractor odometers. While tractor maintenance tracks highway road miles, transmission fluid wear, and tire steer wear, transport refrigeration units (Carrier Transicold, Thermo King) operate on separate diesel engines with distinct run hours, high-pressure scroll compressors, dynamic belt drives, and electrical standby systems. A refrigerated trailer parked at a customer dock for eight hours during a cross-dock consolidation cycle runs its auxiliary engine continuously, absorbing intense thermal wear while accumulating zero chassis miles. Evaluating cold chain assets against dedicated refrigeration metrics allows fleet leaders to identify degrading compressors, low refrigerant charge levels, and electrical alternator anomalies before they cause in-transit thermal failures. Maintenance directors can evaluate these predictive indicators by scheduling a personalized cold chain KPI walkthrough demo or configure test reefer profiles via our quick platform sign up.
Preventative Maintenance Compliance (PM Compliance %)
Calculates the percentage of scheduled preventative maintenance inspections completed within your designated operational tolerance window (typically ± 50 TRU diesel engine hours or ± 14 calendar days). When PM compliance falls below 90%, fleets experience a direct correlation in catastrophic roadside compressor seizures.
Planned vs. Unplanned Maintenance Ratio
Compares scheduled shop work hours (oil analysis, drive belt tensioning, sensor calibration, filter swaps) against reactive emergency repairs (blown hoses, roadside reefer alarms, alternator failures). Best-in-class operations operate on an 80/20 planned-to-unplanned ratio, ensuring garage bays remain productive rather than chaotic.
Mean Time Between Failures (MTBF - Refrigeration Units)
Measures the average number of auxiliary engine operating run hours between critical operational failures that require shop intervention. Tracking MTBF across specific reefer makes, models, and age cohorts exposes underperforming units, bad component batches, and aging assets ripe for replacement.
Reefer Fleet Operational Uptime Percentage
Quantifies the total hours refrigeration assets are mission-ready to accept food cargo versus hours grounded in shop bays or staged for pending parts. Maintaining high uptime guarantees that sudden customer volume surges or seasonal harvest waves can be absorbed without expensive outside equipment leases.
Direct Benchmark Comparison: Lagging Industry Averages vs. FleetRabbit Best-in-Class
Operating a refrigerated fleet without centralized maintenance software forces operations into reactive chaos: maintenance technicians scramble between unexpected breakdown calls, parts rooms stock out of critical reefer belts, and equipment depreciation accelerates unchecked. Review how lagging industry standards compare directly against top-quartile operations powered by FleetRabbit's automated cold chain CMMS engine. Transportation vice presidents can evaluate custom fleet ROI projections by booking an executive software benchmarking demo or explore automated work order workflows through our self-service sign up.
| Cold Chain Maintenance KPI | Lagging Industry Average (Paper & Excel) | Top 10% Fleet Benchmark (FleetRabbit) | Operational & Financial Impact |
|---|---|---|---|
| PM Compliance Rate | 81.4% (Frequent overdue services) | 96.8% (Tight engine-hour adherence) | Reduces in-transit thermal failures by 62% |
| Planned vs. Unplanned Ratio | 58% Planned / 42% Unplanned (Emergency mode) | 85% Planned / 15% Unplanned (Proactive cadence) | Cuts emergency road call expenses by $1,400+/event |
| Reefer Maintenance Cost per Operating Hour | $2.85 - $3.40 / run-hour | $1.65 - $1.95 / run-hour | Saves over $2,100 per trailer annually in shop spend |
| Average Work Order Turnaround Time | 6.8 Days (Parts delays & unassigned bays) | 1.8 Days (Automated parts staging & digital WOs) | Improves trailer asset availability by 12% |
| OEM Chassis & TRU Warranty Recovery | < 35% (Missed claims; paper invoices lost) | 98.5% (Automated warranty flag on parts) | Recovers tens of thousands annually from manufacturers |
4-Stage Closed-Loop Cold Chain Maintenance Workflow
FleetRabbit standardizes preventative maintenance across every phase of the asset lifecycle, connecting daily driver inspections to garage mechanics and long-term capital replacement planning.
Telematics Ingestion & eDVIR
The platform continuously ingests auxiliary TRU engine hours, battery voltages, and diagnostic fault codes (DTCs), combining telematics with daily driver smartphone pre-trip walkaround inspections.
Predictive Work Order Generation
When an engine-hour threshold approaches or a minor fault triggers (such as high discharge pressure), the system automatically creates a prioritized shop work order and reserves necessary parts.
Technician Bay Execution & Barcode Checkout
Mechanics view step-by-step digital service tasks on shop tablets, scan replacement filters and drive belts out of inventory via barcode, and record exact labor hours directly on the ticket.
Audit Ledger Sync & Asset Life Modeling
Completed maintenance logs update vehicle service histories, clear open driver inspection defects, file eligible OEM warranty claims, and update long-term asset depreciation and replacement schedules.
Financial Capital Stewardship: Where Unmonitored Reefers Bleed Budget
Operating a fleet of multi-temperature trailers without connected maintenance tracking software causes compounding financial drains across unexpected roadside service calls, lost driver hours, and catastrophic cargo claims. Identifying these systemic cost drivers helps maintenance directors build a compelling business case for modern maintenance management software before executive leadership. Measure your fleet's exact cost recovery by booking a personalized cost assessment demo or get started directly via our rapid platform sign up.
Top Causes of Cold Chain Maintenance Budget Drain
Platform Engineering Capabilities
Triggers preventative maintenance work orders based on actual TRU diesel run hours rather than misleading tractor odometer miles.
Monitors minimum bin levels, automates supplier re-orders, and tracks core return deposits so manufacturer credits are never lost.
Seamlessly integrates with Carrier Transicold APX/Advance and Thermo King SR-3/SR-4 microprocessors with zero hardware lock-in.
ROI & Scalability Framework for Refrigerated Fleet Maintenance
When engineering an enterprise cold chain maintenance program, operations executives must measure financial return across vehicle longevity, labor efficiency, fuel savings, and cargo protection. FleetRabbit delivers quantifiable financial return across all primary refrigeration operating categories.
Emergency Service Savings
Driving PM compliance above 95% cuts emergency roadside breakdowns by over 60%. Eliminating just two roadside service calls per trailer covers the software investment for years.
Compressor & Engine Life
Timely oil sampling, belt tensioning, and valve adjustments prevent catastrophic compressor lockups, extending the operational service life of expensive refrigeration units by 3+ years.
Zero Thermal Rejections
Proactive maintenance ensures transport refrigeration units hold precise setpoints without unexpected mid-route shutoffs, safeguarding customer cargo and defending shipper scorecards.
Frequently Asked Questions: Cold Chain Fleet Maintenance KPIs
Why is tractor odometer mileage inadequate for scheduling refrigerated trailer maintenance?
Tractor odometer mileage only tracks road travel distance. A refrigerated trailer often runs its auxiliary diesel engine for hours while parked at loading docks, staging in cross-dock yards, or pre-cooling before pickup. Tracking maintenance by vehicle odometer miles ignores hundreds of operating engine hours, leading to overdue oil changes, stretched drive belts, and unexpected compressor failures.
What is a healthy planned versus unplanned maintenance ratio for a reefer fleet?
A top-quartile refrigerated fleet targets an 80/20 ratio: 80% planned preventative maintenance (scheduled services, inspections, planned part replacements) and 20% or less unplanned maintenance (emergency breakdown repairs, unexpected fault code resolution). Fleets with unplanned maintenance exceeding 35% typically suffer from severe budget overruns and high cargo rejection rates.
How does preventative maintenance compliance affect transport refrigeration reliability?
Preventative maintenance compliance measures whether required services are completed within established engine-hour windows (such as every 1,500 or 3,000 TRU run hours). Strict compliance ensures clean fuel filters, properly tensioned alternator and compressor belts, unblocked condenser coils, and fresh compressor lubricants, directly preventing unexpected in-transit shutdowns.
Does implementing FleetRabbit require installing proprietary hardware in our reefer trailers?
No. FleetRabbit operates on a flexible, hardware-agnostic architecture. It connects directly with existing trailer telematics gateways, factory OEM modems (Carrier Transicold e-Solutions, Thermo King TracKing), standard J1939 CAN-bus ports, or standalone wireless Bluetooth Low Energy (BLE) temperature and vibration sensors with zero hardware lock-in.
Achieve Total Cold Chain Fleet Reliability and Lower Maintenance Costs Today
Eliminate unexpected reefer breakdowns, automate preventative maintenance scheduling, and empower your mechanics with digital work orders. Experience FleetRabbit today with zero proprietary hardware lock-in.