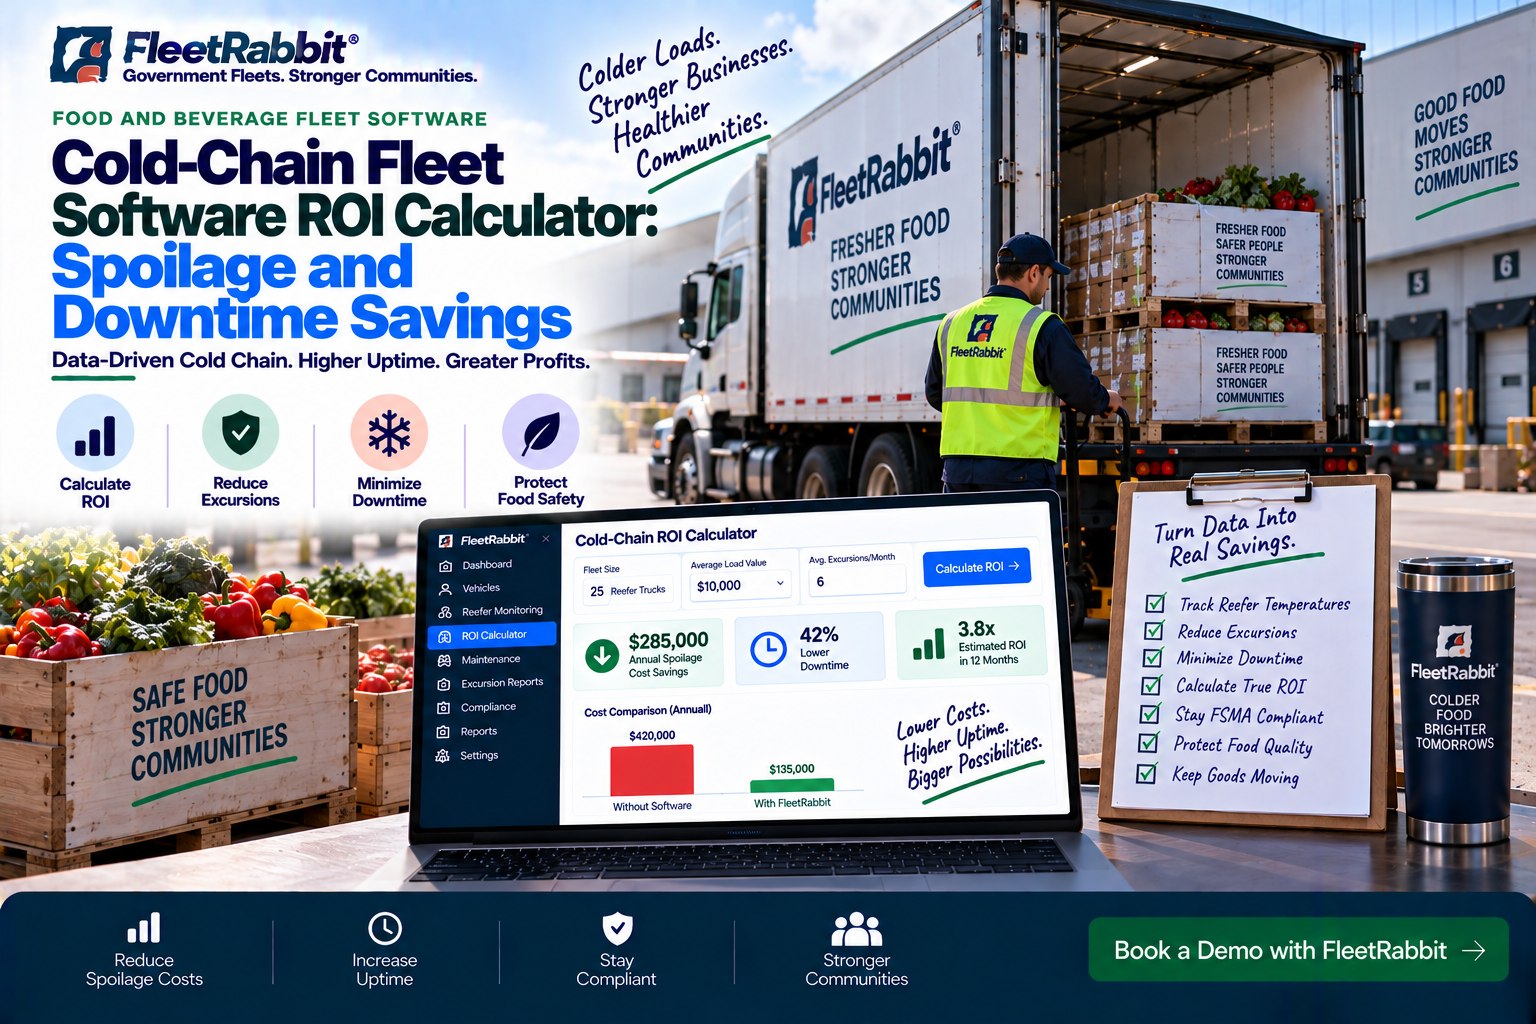
A single reefer excursion can wipe out the margin on an entire truckload — and most fleets don't find out until the load is already condemned. If you run temperature-controlled freight, the question isn't whether cold chain fleet software pays for itself. It's how fast, and by how much. This is the breakdown distributors, 3PLs, and private fleets use to put real numbers behind that question.
Where Cold Chain Fleets Actually Lose Money
Most fleet managers can quote their fuel cost per mile without blinking. Far fewer can tell you what a single undetected temperature excursion costs once you add spoilage write-offs, the customer chargeback, the missed delivery window, and the driver hours spent redoing the run. That gap is exactly where cold chain fleet software roi becomes measurable instead of theoretical — you can't fix what you never priced out. Distributors who sign up for FleetRabbit usually start by running this exact audit on their own fleet in the first week.
Loads condemned or discounted because a temperature deviation went unnoticed for hours instead of minutes.
Reefer units breaking down mid-route because engine-hour maintenance was tracked on a spreadsheet, not triggered automatically.
Units left running longer than necessary, idling inefficiently, or cycling harder because of poor pre-trip checks.
Missing or incomplete temperature logs surfacing during an FSMA audit, with no defensible paper trail.
The ROI Math Behind Cold Chain Fleet Software
When distributors ask us to prove cold chain fleet software roi tracking on paper, we walk through four numbers together: current spoilage rate, average reefer downtime hours per month, current maintenance spend, and the size of the fleet. Plug those into a simple model and the payback period usually shows up faster than most teams expect.
Here's what that looks like for a mid-size distributor running 25 reefer trucks. Fleets that already track this closely enough to build a case internally usually move straight to a book demo conversation, because the model only confirms what the spreadsheet is already hinting at.
| Cost Category | Before Fleet Software | With FleetRabbit | Monthly Impact |
|---|---|---|---|
| Spoilage write-offs | 3.1% of loads | 0.8% of loads | Recovered revenue |
| Reefer downtime | 18 hrs / truck | 5 hrs / truck | Fewer missed windows |
| Emergency repairs | Reactive | Scheduled PM | Lower repair bills |
| Audit prep time | Days of manual pulls | Automated logs | Hours saved per audit |
See Your Own Numbers, Not Industry Averages
Every fleet's cold chain fleet software roi for distributors looks different depending on lanes, load values, and current maintenance discipline. The fastest way to know your real number is to look at it directly instead of guessing from benchmarks.
How FleetRabbit Tracks ROI in Practice
Cold chain fleet software roi reporting only means something if it's tied to live data, not a quarterly guess. FleetRabbit pulls temperature telemetry, reefer engine hours, and maintenance records into a single dashboard so the savings are visible in real time instead of reconstructed after the fact during a finance review.
Real-Time Excursion Alerts
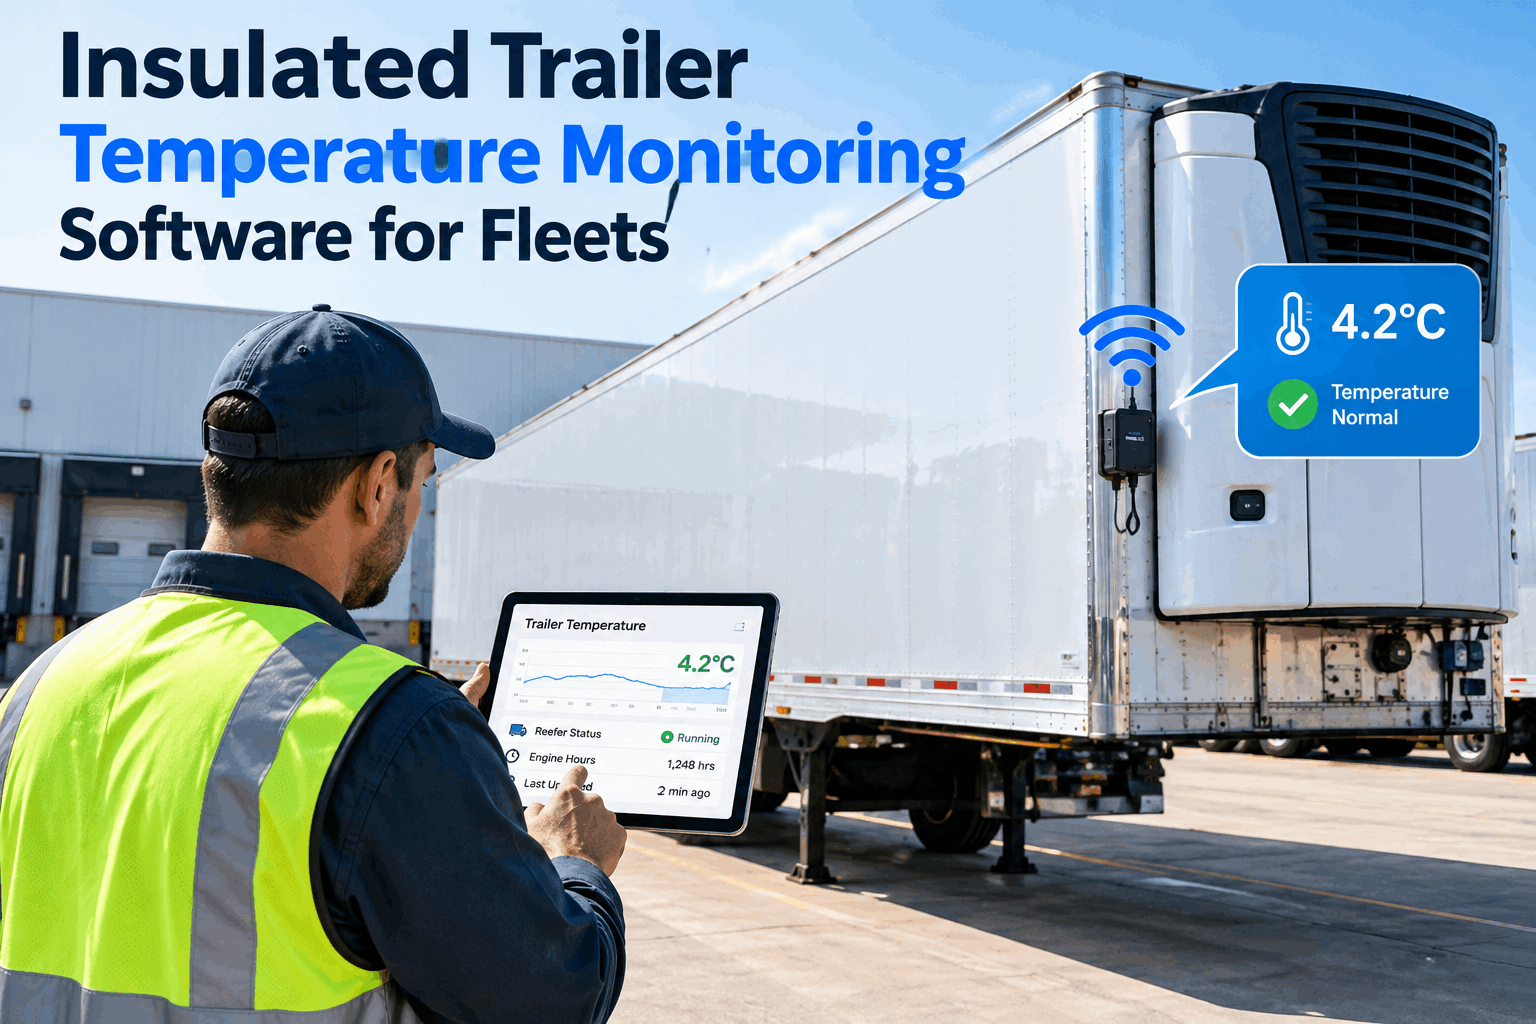
Temperature deviations trigger alerts within minutes, giving dispatch time to intervene before a load is condemned.
Engine-Hour Based Maintenance
Reefer PM schedules trigger off actual run hours, not mileage or guesswork, catching failures before they happen on the road.
Automated Compliance Logs
Every temperature reading and maintenance event is logged automatically, ready for FSMA, GDP, or customer audits on demand.
ROI Dashboard
Spoilage avoided, downtime reduced, and fuel saved are calculated automatically so you always know where you stand.
Best Practices for Maximizing Cold Chain Fleet Software ROI
Software alone doesn't create savings — how a fleet uses it does. Teams that see the strongest cold chain fleet software roi best practices in action tend to share three habits: they act on excursion alerts within minutes instead of reviewing them the next day, they let engine-hour data drive maintenance scheduling rather than overriding it on instinct, and they review the ROI dashboard weekly instead of once a quarter. If your team is ready to build those habits, the easiest starting point is to sign up and connect your first few trucks.
Set excursion thresholds per commodity. Produce, dairy, and pharma don't share the same tolerance — generic thresholds either miss real risk or flood dispatch with noise.
Track reefer hours separately from tractor mileage. High-cycle routes wear refrigeration units two to three times faster than the tractor pulling them.
Close the loop with drivers. Alerts only help if dispatch and drivers act on them within the same shift, not after the load has already been delivered.
What Distributors Ask Before They Commit
How is cold chain fleet software roi actually calculated?
It's the combined value of reduced spoilage, avoided downtime, lower emergency repair costs, and time saved on compliance reporting, measured against the monthly cost of the platform. Most distributors see positive ROI within the first two to three months once real-time alerts start catching excursions early.
How long does it take to see measurable savings?
Spoilage-related savings typically show up fastest, often within the first few weeks, because excursion alerts start preventing condemned loads almost immediately. Downtime and maintenance savings build over one to two maintenance cycles as engine-hour tracking replaces reactive repairs.
Does this replace our existing telematics or ELD system?
No. FleetRabbit is built to layer on top of existing hardware and telematics feeds, consolidating temperature, maintenance, and compliance data into one dashboard rather than requiring a fleet-wide hardware swap.
Is this suitable for smaller distributor fleets, not just large carriers?
Yes. The ROI model scales down cleanly — smaller fleets often see a faster percentage-based return because a single avoided spoilage event represents a larger share of monthly freight revenue.
What does FSMA-related reporting look like with this software?
Temperature logs, pre-cool documentation, and maintenance records are captured automatically and stored in an audit-ready format, cutting audit preparation from days of manual pulls down to minutes.
Put a Number on Your Cold Chain ROI
Stop estimating spoilage and downtime losses from memory. Sign up and connect your fleet to see live numbers, or book a demo and we'll walk through your specific routes, load values, and current maintenance costs together.