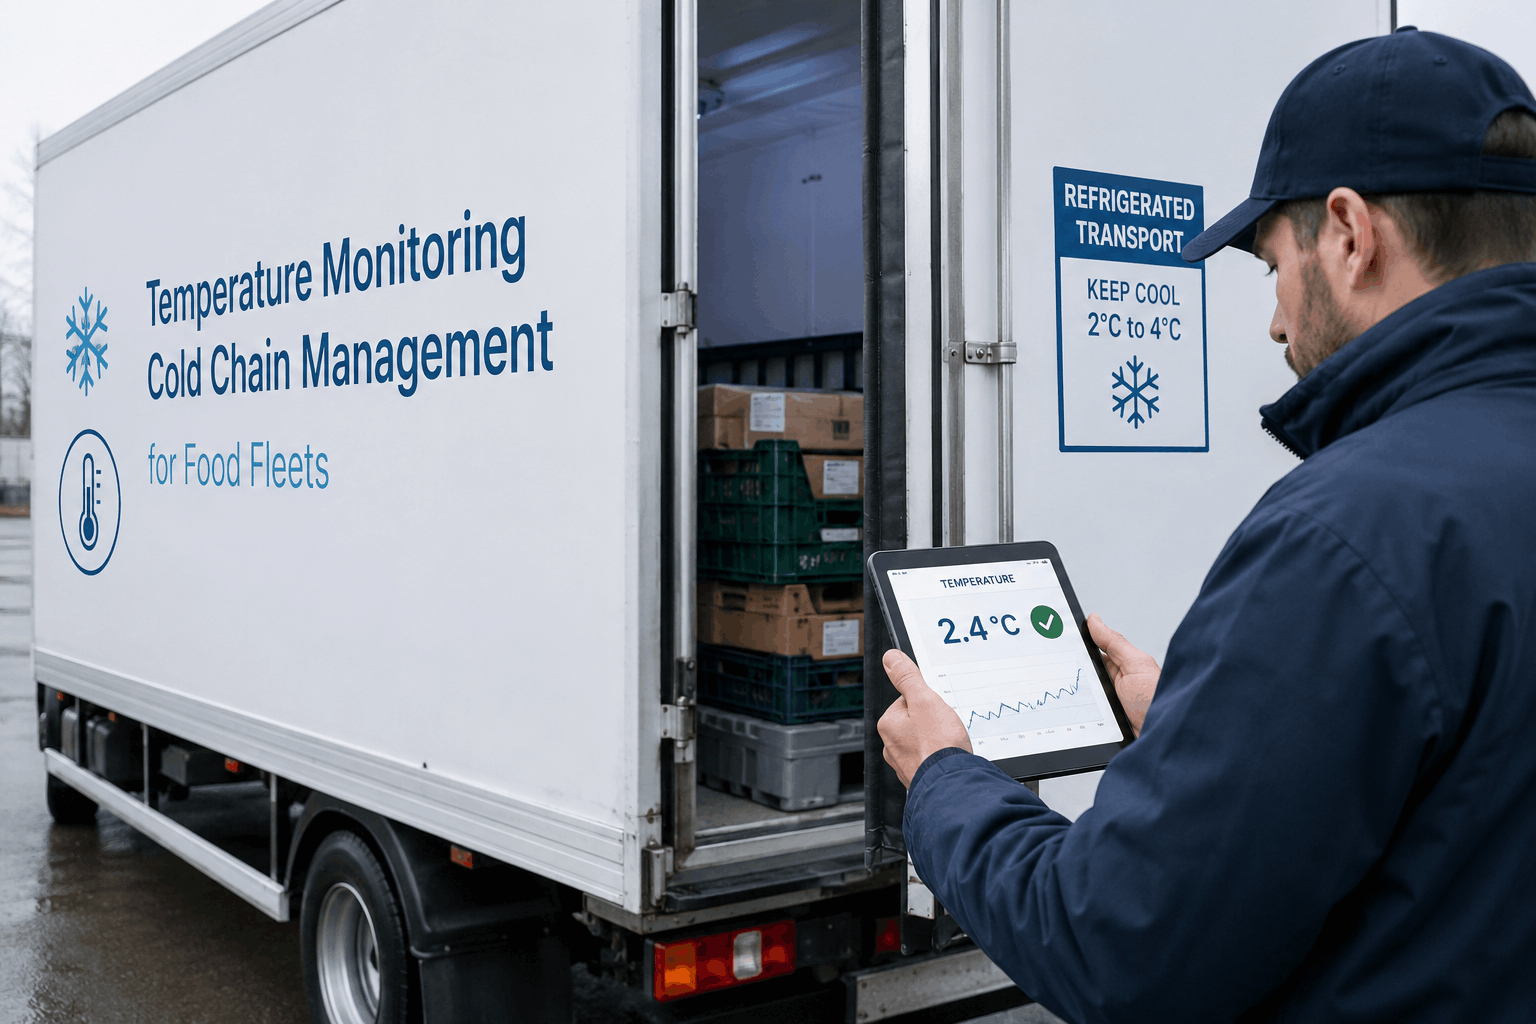
Temperature Monitoring and Cold Chain Management for Food Fleets

cold-chain-management-food-fleets

A food fleet that loses temperature control doesn't lose a shipment—it loses the load value, the customer relationship, the regulatory standing, and the downstream supply chain commitments that depend on that delivery arriving intact. Yet the majority of cold chain failures are not sudden catastrophic refrigeration unit failures. They are slow, detectable, preventable excursions: a door left ajar for twelve minutes at a distribution stop, a setpoint drifted two degrees over four hours while the driver slept at a rest area, a multi-zone trailer mixing ambient and frozen product because nobody verified zone integrity before departure. These failures have one thing in common—they happened in a vehicle without real-time temperature monitoring that could have alerted dispatch in time to intervene. The food fleets achieving sub-2% excursion rates don't have better refrigeration units. They have better visibility: continuous sensor data, multi-zone monitoring, instant threshold alerts, and the documented temperature trail that protects them at customer receiving docks and FDA audit tables. Start your free FleetRabbit trial or book a cold chain demo with our team.

Complete Guide 2026

Temperature Monitoring & Cold Chain Management for Food Fleets

Real-time multi-zone temperature monitoring, threshold alerting, and continuous compliance documentation that keeps frozen, refrigerated, and ambient loads protected from departure to delivery. This guide gives food fleet operators, safety managers, and logistics directors the complete framework for evaluating and implementing cold chain monitoring that prevents spoilage and survives FDA audits.

$35B+ Annual U.S. Cold Chain Losses from Temperature Excursions
11.4% Average Excursion Rate in Manually Monitored Food Fleets
84% Excursion Reduction After Real-Time Monitoring Adoption
24hrs FDA FSMA 204 Record Production Requirement

Why Food Fleets Fail at Cold Chain — and What Changes It

Real-time temperature monitoring is not a technology upgrade — it is an operational transformation. Fleets that transition from driver-reported temperature checks to continuous sensor-based monitoring don't just catch more excursions. They change the entire risk profile of their operation: dispatch teams act in minutes rather than discovering problems at delivery, customers receive verified temperature logs instead of driver attestations, and FDA audits become documentation exports rather than record-search scrambles. Book a Demo.

The 10 Core Capabilities of Cold Chain Monitoring Software

These ten capabilities represent the non-negotiable features that separate enterprise-grade cold chain monitoring from basic data loggers and manual temperature sheets. Each directly impacts load protection, regulatory compliance, and the operational intelligence food fleets need to prevent losses before they happen.


01
Real-Time Sensor Monitoring
Continuous 1–5 minute interval readings streamed live from cargo sensors to dispatch dashboard
Core Feature

02
Multi-Zone Trailer Management
Independent monitoring for frozen, refrigerated, and ambient compartments in a single trailer
Multi-Temp

03
Threshold Breach Alerts
Sub-90-second alerts to driver and dispatch when any zone exceeds its configured temperature limit
Safety Critical

04
FSMA Compliance Logging
Continuous timestamped records retained for 2+ years and exportable within 24 hours of FDA request
Compliance

05
Excursion Analytics & Reporting
Per-route, per-asset, and per-driver excursion rate dashboards with root cause identification
Analytics

06
Pre-Cool Verification
Load authorization blocked until trailer zones reach required setpoints before product contact
Load Protection

07
GPS-Correlated Temperature Trail
Every temperature reading stamped with GPS coordinates — connecting cargo condition to location at every point in the route
Traceability

08
Delivery Temp Proof-of-Delivery
Temperature reading at time of delivery auto-attached to POD — customer-facing compliance report generated automatically
Customer Ready

09
Sensor Calibration Management
Calibration due date tracking per sensor with reference thermometer logs and FSMA-defensible calibration certificates
Audit Ready

10
TMS & ERP Integration
Temperature data flows into existing transportation management and ERP systems without manual data re-entry
Integration

Feature Deep Dives: What Best-in-Class Looks Like

Knowing that a platform offers "real-time monitoring" or "threshold alerts" is not enough. Food fleet operators must evaluate the depth, configurability, and data quality of each feature before committing to a cold chain monitoring system. Here is what the standard should look like for each critical capability.

01
Real-Time Sensor Monitoring
Continuous data streaming vs. periodic download data loggers
Highest Load Protection Impact

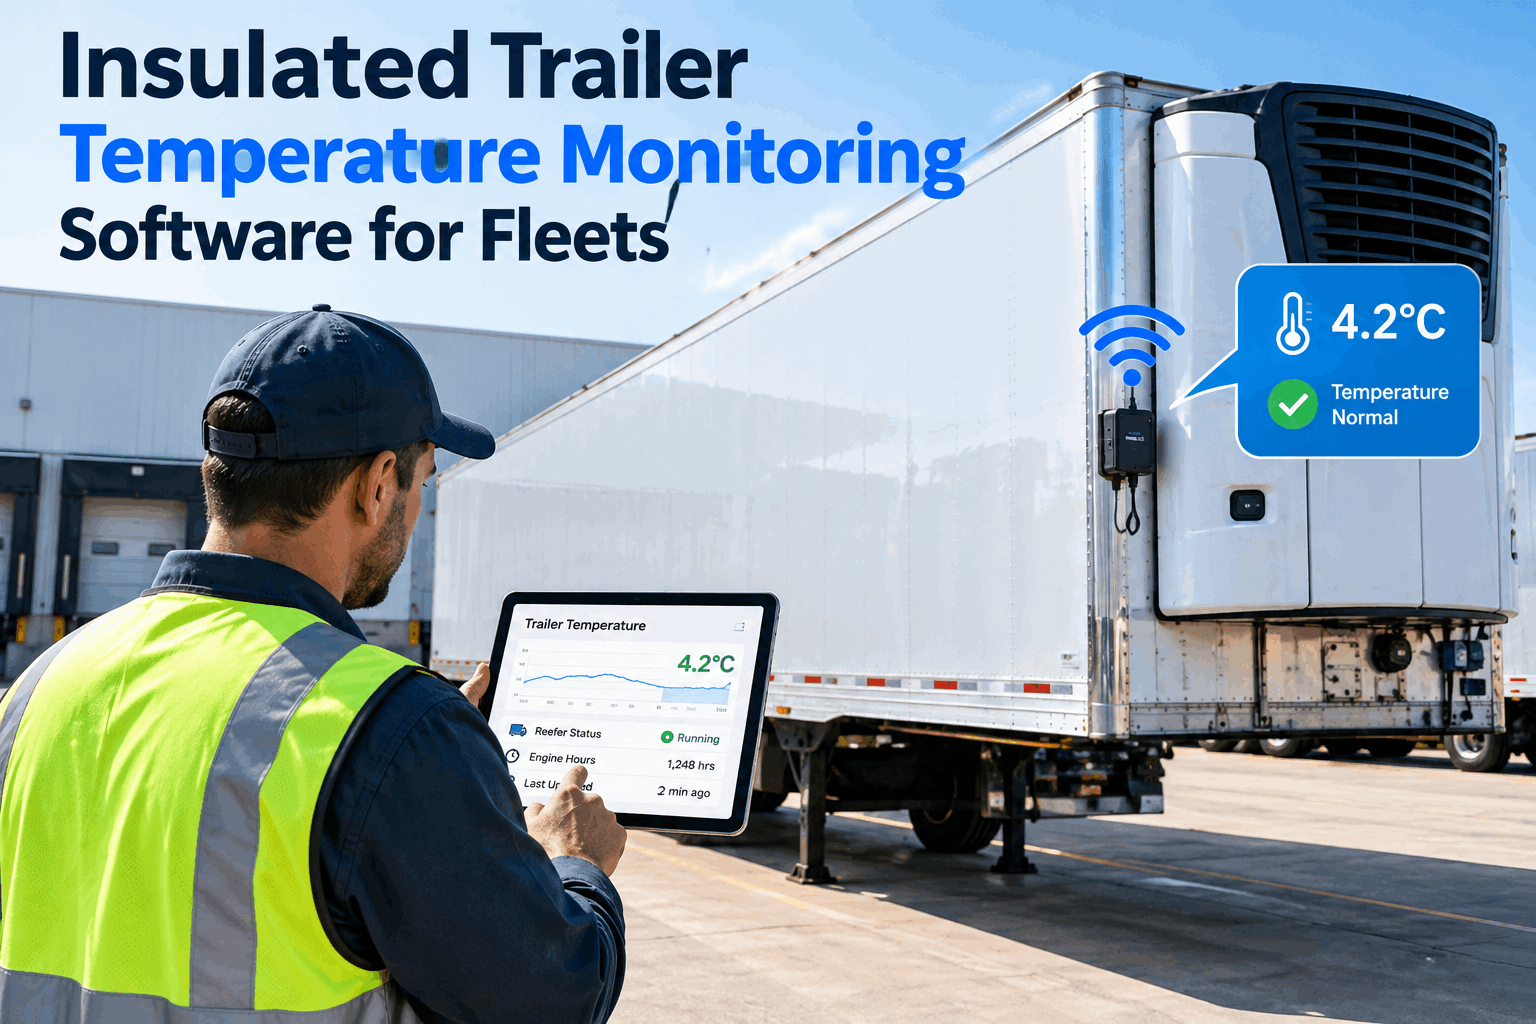
The fundamental difference between real-time monitoring and a data logger is intervention timing. A data logger records an excursion and presents it at delivery — after the loss. Real-time monitoring alerts dispatch within 90 seconds of a threshold breach while the truck is still on route and the load may still be recoverable. Best-in-class systems stream sensor readings every 1–5 minutes via cellular or satellite, with automatic escalation if a reading cannot be transmitted within a defined window. Look for systems that explicitly state the alert latency — "real-time" means nothing if alerts arrive 45 minutes after the threshold was crossed.

1–5 minute reading intervals Sub-90-second threshold alert delivery Satellite fallback for cellular dead zones Alert delivery confirmation logging
02
Multi-Zone Trailer Management
Independent zone control for mixed-temperature food loads
Mixed-Load Critical

Multi-temperature trailers carry frozen, refrigerated, and ambient products in separate compartments separated by bulkheads. Each zone has its own setpoint, its own threshold window, and its own failure risk. A monitoring system that reports a single trailer temperature is useless for multi-zone operations — it tells you the average of three zones, masking an excursion in any single compartment. Best-in-class platforms monitor each zone independently with separate sensor placements, independent threshold configurations by product category, and zone-specific alert routing so the frozen zone breach doesn't generate the same alert as an ambient zone drift.

Independent sensor per zone Per-zone threshold configuration Zone-specific alert escalation paths Bulkhead integrity monitoring
03
FSMA Compliance Logging
21 CFR Part 1 Subpart O record requirements for refrigerated transport
Regulatory Critical

FSMA 204 requires carriers transporting Food Traceability List products to maintain temperature records traceable to specific lots and shipments — not just a general vehicle temperature log. Records must be retained for two years and produced to FDA within 24 hours of a request. This means the monitoring system must link sensor data to bill of lading numbers and load identifiers, not just the vehicle ID. Look for systems that generate FDA-ready compliance packages from a single export, with timestamps, GPS coordinates, calibration references, and load identifiers all assembled automatically.

Shipment-level (not vehicle-level) record linking 2-year minimum record retention 24-hour FDA export capability Calibration records included in compliance package
04
GPS-Correlated Temperature Trail
Location-stamped data for incident investigation and customer disputes
Dispute Resolution

When a customer disputes a delivery claiming product arrived warm, the question is always: where and when did the temperature excursion occur? A temperature log without GPS correlation cannot answer this. A GPS-correlated trail can show precisely that the excursion began at a specific location, identify whether it occurred at a customer stop (door open too long), on the highway (reefer unit issue), or at a distribution center (dwell time in dock), and establish carrier vs. customer responsibility with documentary evidence that holds up in insurance claims and contract disputes.

GPS coordinate stamped on every reading Stop event and door-open correlation Route replay with temperature overlay Carrier liability vs. customer liability attribution
05
Excursion Analytics & Root Cause Reporting
Fleet-wide pattern analysis that prevents recurrence
Loss Prevention

Individual excursion alerts prevent single-incident losses. Excursion analytics prevent systemic losses. When a platform can show that 68% of excursions occur on routes with afternoon delivery windows in summer months, or that three specific trailers account for 40% of all excursions, fleet managers can act on patterns rather than incidents. Best-in-class analytics surfaces excursion frequency by driver, by asset, by route corridor, and by time of day — turning reactive incident management into proactive fleet improvement.

Excursion rate by driver and asset Route corridor and time-of-day analysis Repeat excursion asset flagging Root cause categorization (reefer, door, dwell)

Temperature Standards by Load Category

Not all food loads share the same temperature requirements. A cold chain monitoring system must be configurable to the specific threshold windows of each product category — and must alert based on those product-specific thresholds, not a generic warm/cold binary. The matrix below shows standard temperature ranges and monitoring requirements for the primary food load categories.

Cold Chain Temperature Standards by Load Category
Load Category Required Range Alert Threshold Excursion Risk
Frozen (Ice Cream, Seafood) ≤ 0°F (-18°C) +3°F above setpoint Condemned Load
Frozen (General Frozen Foods) ≤ 10°F (-12°C) +5°F above setpoint High Loss Risk
TCS Foods (Dairy, Meat, Produce) ≤ 41°F (5°C) +3°F above setpoint FSMA Violation
Fresh Produce (Cold-Sensitive) 34°F–41°F (1–5°C) ±2°F from setpoint Quality Loss
Chilled Beverages & Floral 33°F–41°F (0.5–5°C) +4°F above setpoint Customer Claim
Ambient Dry Goods 55°F–75°F (13–24°C) +10°F above setpoint Quality Alert
Pharmaceuticals (Co-load) 36°F–46°F (2–8°C) ±1°F from setpoint Regulatory Recall

ROI Calculator: Manual vs. Real-Time Cold Chain Monitoring

Annual Cost Comparison: 40-Unit Refrigerated Food Fleet Based on industry benchmarks for regional food distribution operations
Manual / Data Logger Monitoring
Condemned load incidents (avg 14/yr)$728,000
Customer claim settlements$95,000
FSMA audit preparation labor$32,000
Manual temperature log admin$18,000
Insurance premium (excursion risk)$44,000
Total Exposure: $917,000+ / Year
VS
FleetRabbit Real-Time Monitoring
Platform subscription (annual)$18,000–$32,000
Sensor hardware (amortized)$8,000–$14,000
Condemned loads (avg 2/yr after)$104,000
Customer claims (documented disputes)$8,000
FSMA audit (automated records)$2,000
Net Cost: $140,000–$160,000 / Year
See Real-Time Cold Chain Monitoring in Action for Your Fleet
FleetRabbit gives food fleets continuous multi-zone temperature monitoring, sub-90-second threshold alerts, GPS-correlated temperature trails, automatic FSMA compliance logging, and excursion analytics — in one platform purpose-built for refrigerated food distribution. No data loggers. No compliance gaps. No condemned loads that could have been saved.

Monitoring Priorities by Fleet Type

Different food distribution operations face different cold chain risk profiles. A long-haul frozen food carrier faces different monitoring challenges than a last-mile grocery delivery fleet or a pharmaceutical cold chain operator. Understanding your fleet type helps identify which monitoring capabilities to prioritize during platform selection.
Long-Haul Refrigerated
Satellite Backup (critical) Reefer Unit Integration Extended Dwell Monitoring Driver Sleep Alert Protocol
Long routes traverse cellular dead zones — satellite fallback and overnight monitoring with escalation to terminal dispatch are non-negotiable
Multi-Stop Food Distribution
Door-Open Event Monitoring (critical) Multi-Zone Trailer Per-Stop Temp Logging Delivery POD Integration
Frequent door-open events at each stop are the primary excursion cause — monitoring that correlates door events with temperature impact is essential
Pharmaceutical / High-Value Cold Chain
±1°F Precision Monitoring (critical) Calibration Management Chain of Custody Logging Regulatory Audit Package
Tightest tolerance requirements — sensor calibration frequency, precision accuracy, and regulatory documentation quality are the primary differentiators
Cold Chain Program Health Benchmarks Target KPIs for a best-in-class food fleet temperature monitoring operation
100%
Loads Monitored
Every food load has continuous temp coverage
<90s
Alert Latency
Max seconds from breach to dispatch notification
<2%
Excursion Rate
Target load excursion rate after platform adoption
100%
FSMA Coverage
All regulated shipments with compliant documentation
ZERO
Manual Temp Logs
Paper temperature records eliminated entirely
96%+
On-Time Delivery Integrity
Deliveries confirmed in-spec at receiving dock

Frequently Asked Questions

Q. What is the difference between a data logger and real-time temperature monitoring?
A data logger records temperature at set intervals and stores the data locally on the device — retrievable only when physically downloaded at the end of the route. It tells you what happened but cannot trigger any intervention while the load is still in transit. Real-time monitoring streams sensor data via cellular or satellite to a cloud dashboard every 1–5 minutes, with automatic threshold alerts delivered to dispatch and driver within seconds of a breach. The practical difference: a data logger documents a loss. Real-time monitoring prevents it. For fleets transporting TCS foods under FSMA, real-time monitoring also satisfies the continuous-record requirement more defensibly than periodic data logger entries.
Q. How does FleetRabbit handle temperature monitoring in cellular dead zones?
FleetRabbit-compatible sensors store readings locally when cellular signal is unavailable, transmitting the full buffered dataset immediately when connectivity is restored. For long-haul routes through persistent dead zones, satellite-connected sensor options transmit data continuously regardless of cellular coverage. The system flags any data gap exceeding a configured threshold (typically 15 minutes) as a monitoring gap event, which is logged in the compliance record so auditors can see that the gap was a connectivity interruption, not a data deletion. Alert delivery is also held and transmitted in sequence once connectivity resumes, preserving the complete audit trail.
Q. What FSMA documentation does FleetRabbit automatically generate?
FleetRabbit automatically generates FSMA-compliant temperature records that include: continuous timestamped temperature readings linked to specific shipment/BOL identifiers, GPS coordinates for each reading, pre-cool confirmation logs with timestamp and zone temperatures at load departure, threshold excursion events with duration, magnitude, and escalation actions taken, sensor calibration records and calibration dates, and proof-of-delivery temperature readings. The complete compliance package for any shipment can be exported as a PDF or structured data file within minutes of an FDA request — no manual record compilation required. All records are retained for the required two-year minimum period in cloud storage with access logs.
Q. How should we configure temperature threshold alerts for different load categories?
Threshold configuration should reflect both regulatory requirements and product-specific spoilage curves. For TCS foods the FDA defines the danger zone as above 41°F — but setting your alert threshold at exactly 41°F leaves zero intervention window. Best practice is to set alerts at 38–39°F for refrigerated TCS loads, giving dispatch a 2–3 degree intervention window before regulatory threshold is crossed. For frozen loads, set alerts at 3–5°F above setpoint rather than at the absolute maximum, so reefer unit performance degradation is caught before a full excursion occurs. FleetRabbit allows per-zone, per-route threshold configuration so different product categories on the same truck can have independent alert windows — critical for multi-temperature operations.
Q. How does temperature monitoring reduce insurance costs for refrigerated fleets?
Cargo insurance and commercial liability premiums for refrigerated food carriers are directly influenced by the fleet's documented loss history and the quality of their risk controls. Fleets that can demonstrate continuous temperature monitoring, sub-2% excursion rates, and GPS-correlated incident documentation present materially lower risk to underwriters than fleets running manual logs. In practice, fleets adopting real-time monitoring typically see 8–15% premium reductions at renewal when presenting their monitoring adoption and improved loss statistics. Additionally, GPS-correlated temperature trails resolve disputed customer claims more quickly — many of which would otherwise result in insurance claims — by definitively establishing whether an excursion occurred pre-delivery or post-delivery at the customer's receiving dock.
Ready to Eliminate Temperature Excursions and Compliance Risk?
FleetRabbit brings all 10 cold chain monitoring capabilities into a single platform designed specifically for food distribution fleets — with real-time multi-zone alerts, automatic FSMA documentation, GPS-correlated temperature trails, and excursion analytics that prevent losses before they happen. Start your free trial or talk to a cold chain specialist today.

May 20, 2026 By Taylor
All Posts

Share This Story, Choose Your Platform!

Latest Posts

Scroll