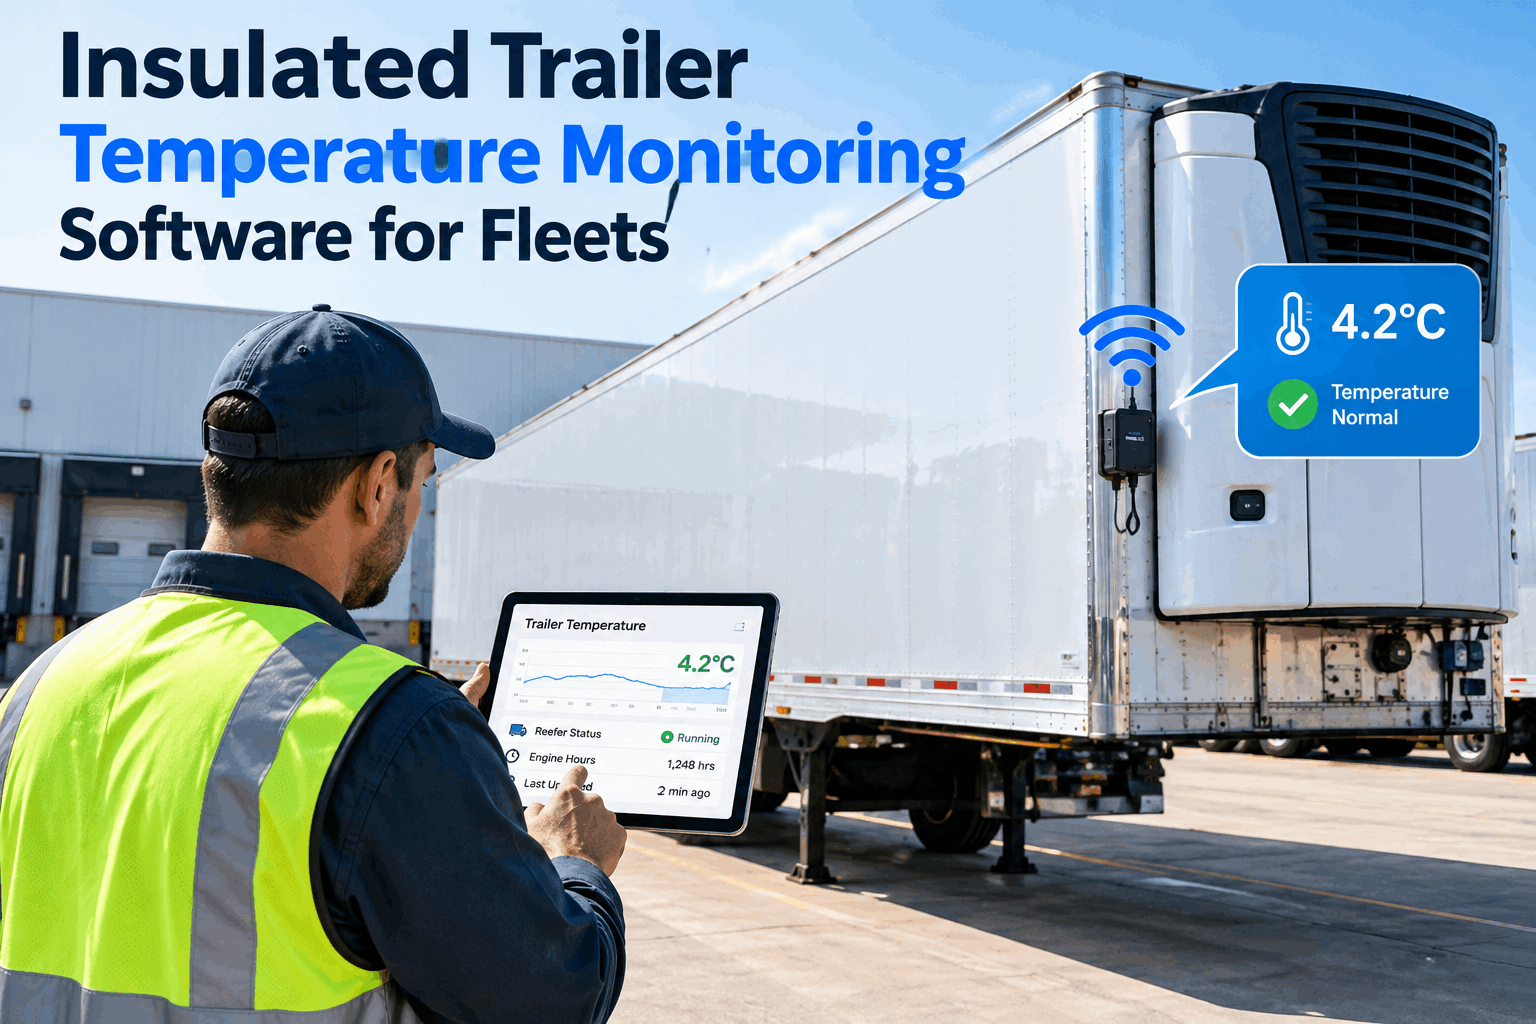
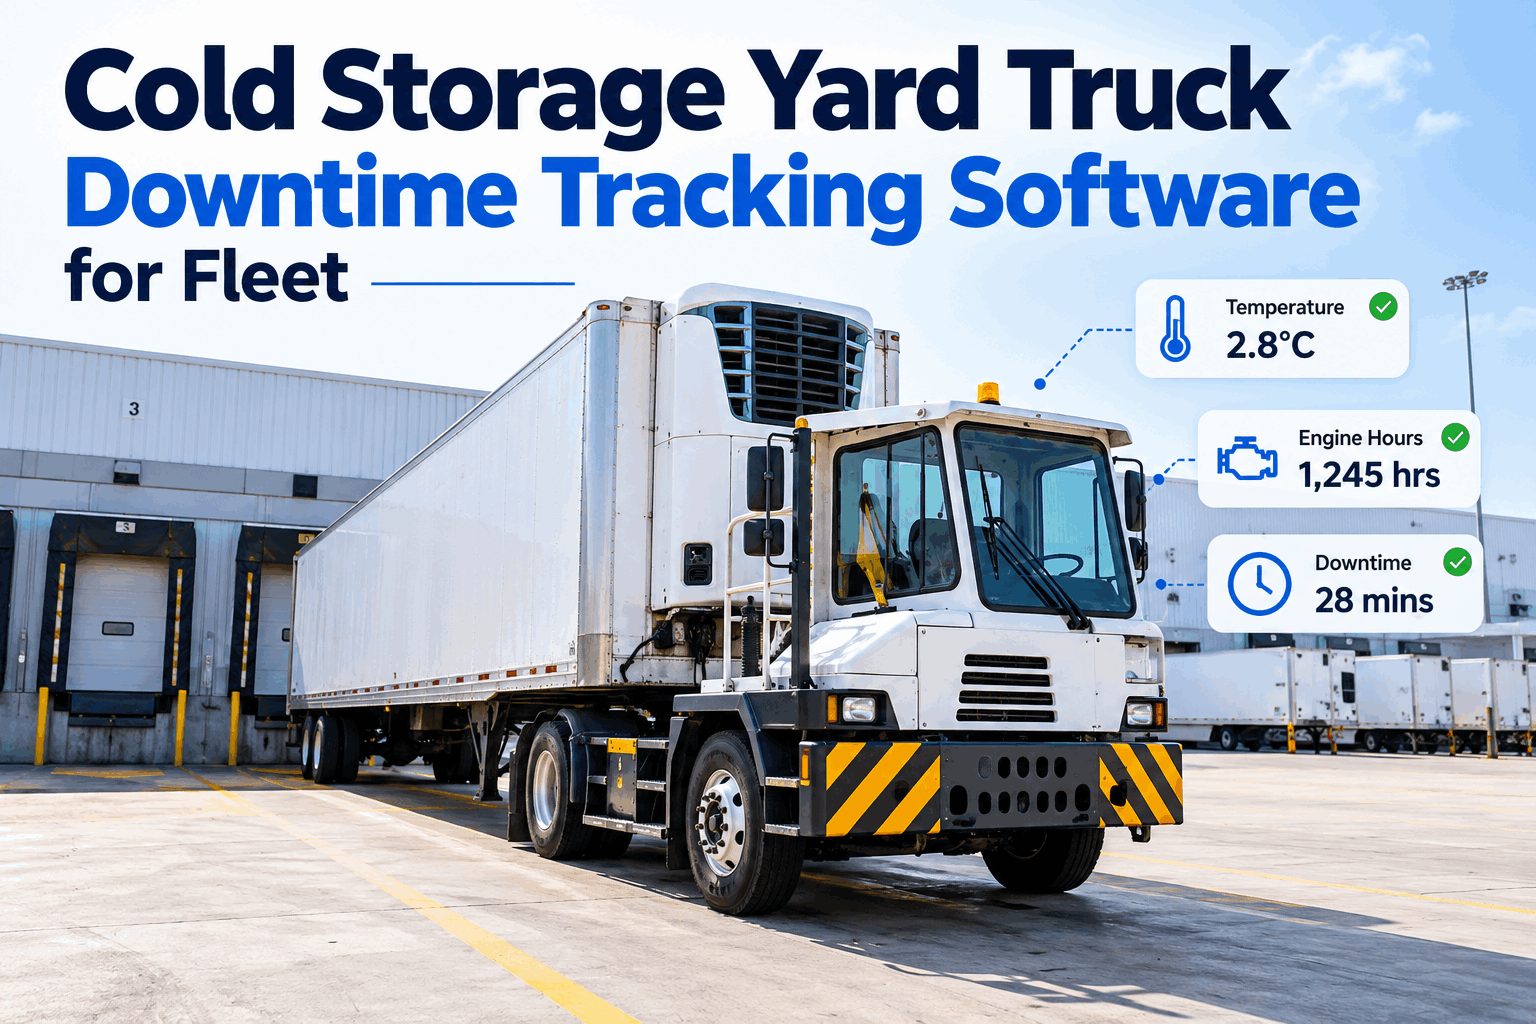
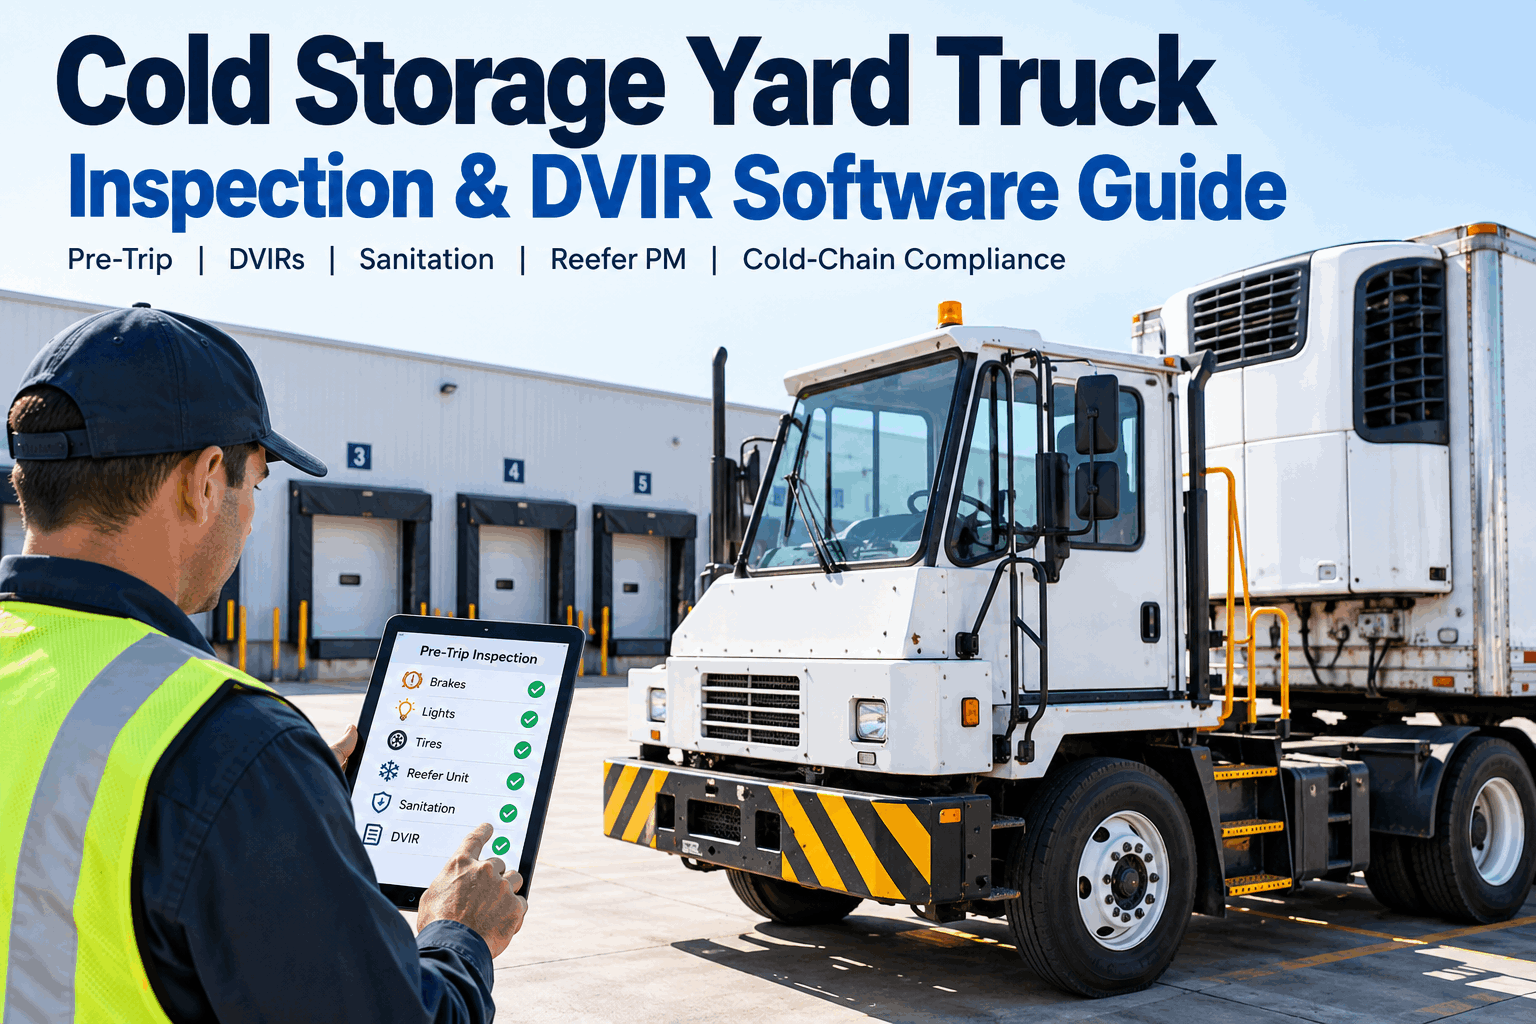
Food and beverage fleet managers face a uniquely demanding challenge — refrigerated trucks and trailers must maintain precise temperature windows around the clock while simultaneously hitting tight delivery schedules, meeting food safety compliance requirements, and controlling operating costs. Yet the average food distribution fleet manager spends 7–9 hours per week manually pulling utilisation data from telematics portals, reefer monitoring systems, and fuel logs just to answer fundamental questions: "Are our refrigerated units being fully utilised? Which assets are causing the most product loss? Are our cold chain compliance rates meeting FDA requirements?" FleetRabbit eliminates that manual burden entirely — delivering real-time cold chain analytics and automated utilisation reporting across every asset in your food and beverage fleet. This guide covers the 8 critical utilisation metrics every food distribution fleet manager must track and how FleetRabbit automates each one. Book a demo to see FleetRabbit's cold chain analytics dashboard.
FleetRabbit Cold Chain Analytics
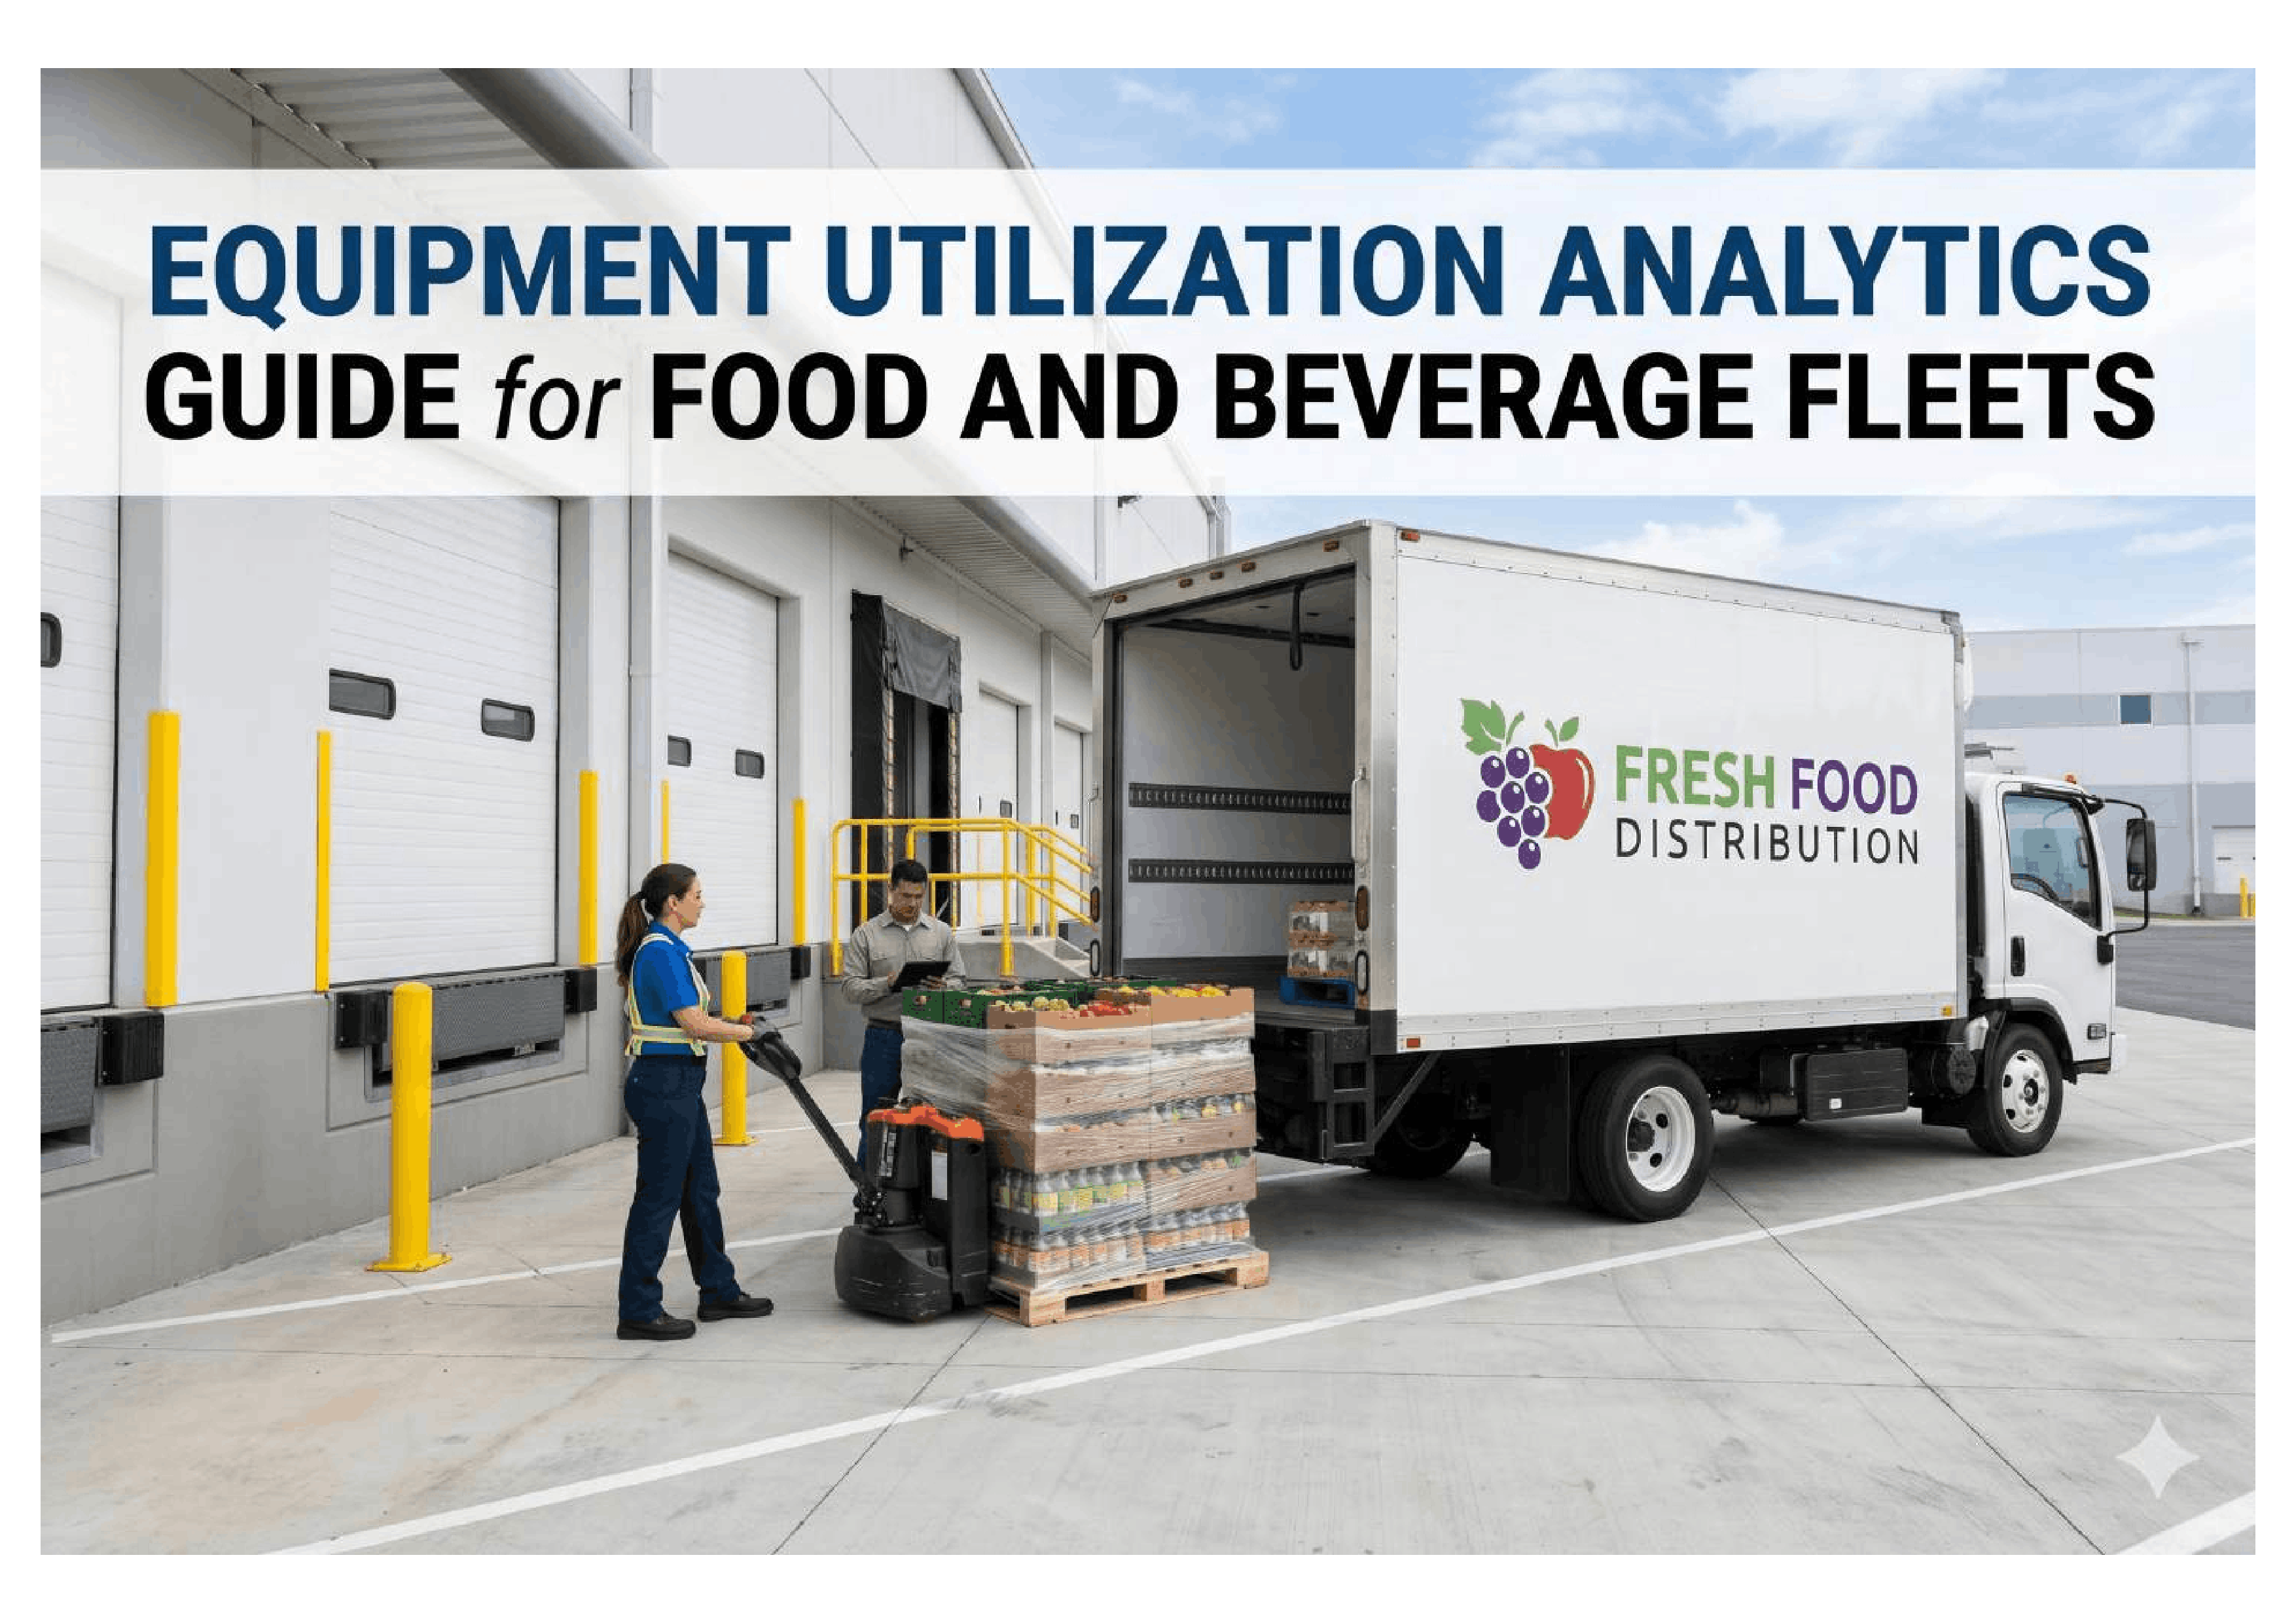
Equipment Utilization Analytics Guide for Food & Beverage Fleets
How utilization analytics maximize refrigerated truck and trailer performance while reducing product loss in food distribution — covering food fleet utilization, refrigerated fleet analytics, cold chain utilization, and automated FleetRabbit analytics.
8Cold Chain KPI Categories
Real-TimeReefer & Fleet Analytics
ZeroManual Report Building
7–9 hrs/wkManager Time Saved
1. Refrigerated Truck & Trailer Utilisation Rate
Utilisation rate is the foundation of food fleet profitability — it measures how many hours your refrigerated assets are actively hauling product versus sitting idle at a dock or yard. Idle refrigerated units still consume fuel running reefer engines to maintain temperature, meaning underutilisation doubles the cost: idle depreciation plus wasted fuel. The optimal utilisation window for temperature-controlled assets is 70–82%, balancing revenue generation with adequate maintenance windows.
Benchmark — Optimal70–82%
Benchmark — UnderutilisedBelow 55%
Benchmark — Over-utilisedAbove 88%
FleetRabbit TrackingAutomatic via telematics & reefer hour data
FleetRabbit calculates utilisation per refrigerated truck, per trailer, per distribution route, and fleet-wide — updated in real time from integrated telematics and reefer unit data. Underutilised cold assets flagged for route reallocation; over-utilised units flagged before accelerated compressor wear sets in. Weekly utilisation reports auto-delivered to fleet managers and distribution supervisors.
2. Reefer Unit Run Hours vs. Truck Engine Hours
In refrigerated fleets, the ratio between reefer unit run hours and truck engine hours reveals critical operational intelligence. A reefer running significantly more hours than the truck engine means drivers are leaving refrigeration running during long dock waits — burning fuel unnecessarily. A ratio below expected thresholds may indicate reefer units being shut down improperly, creating dangerous temperature excursions that risk product loss and FDA compliance violations.
Normal ratio (typical route)1.05–1.20
Excessive idle indicatorAbove 1.40
Potential temp excursion riskBelow 0.90
FleetRabbit AlertTriggered on ratio deviation >15%
FleetRabbit cross-references reefer unit telematics with truck engine hour data to calculate the ratio per asset and per driver. Abnormal ratios trigger automatic alerts — catching excessive dock idling that inflates fuel cost and identifying potential temperature management failures before product reaches unsafe temperatures. Reports delivered daily to fleet and food safety managers.
3. Temperature Excursion Rate & Cold Chain Compliance
Every temperature excursion is a potential product loss event and an FDA FSMA compliance exposure. A single excursion on a full trailer load can result in $15,000–$80,000 in rejected product. Tracking excursion frequency per asset, per route, and per driver identifies systemic cold chain failures — whether caused by equipment defects, door discipline, or improper setpoint management — before they become recurring losses.
Industry Average91%
FleetRabbit Customers (avg)98.4%
FDA FSMA Target99%+
Avg product loss per excursion$15K–$80K per load
FleetRabbit integrates reefer temperature sensor data to log every excursion event with timestamp, asset ID, duration, and maximum temperature deviation. Excursion reports are automatically generated for FSMA record-keeping and flagged in real time to dispatch and food safety teams. Trending analysis identifies which assets or drivers generate the highest excursion frequency for targeted corrective action.
FleetRabbit Cold Chain Intelligence
Every Metric on This Page — Automated, Real-Time, and Delivered to Your Dashboard
FleetRabbit eliminates manual cold chain reporting. Every KPI in this guide is calculated automatically from reefer telematics, truck engine data, work orders, inspection records, and fuel logs — updated in real time and delivered via customisable dashboards and scheduled email reports.
4. Reefer Fuel Consumption Per Load Mile
Reefer units in food distribution fleets consume 0.4–0.8 gallons of diesel per hour independent of the truck engine — making reefer fuel a major cost line that most operators track poorly. Monitoring reefer fuel consumption per load mile reveals efficiency anomalies: rising consumption indicates refrigeration unit deterioration, gasket failures allowing heat ingress, or drivers setting unnecessarily aggressive setpoints. Addressing these issues fleet-wide typically reduces reefer fuel costs by 12–18%.
Trailer reefer (benchmark)0.40–0.65 gal/hr
Truck-mounted reefer (benchmark)0.55–0.80 gal/hr
Multi-temp unit (benchmark)0.70–1.05 gal/hr
Alert Trigger15%+ above asset baseline
FleetRabbit combines reefer fuel log entries with telematics mileage data to calculate consumption per asset. When a unit's reefer fuel consumption rises 15% above its established baseline, an alert is generated for maintenance investigation — catching refrigeration unit deterioration, door seal failures, and setpoint abuse before they escalate into product loss events or costly compressor replacements.
5. Preventive Maintenance Compliance for Refrigerated Assets
PM compliance in refrigerated fleets carries higher stakes than in standard truck fleets — a missed reefer PM that leads to compressor failure mid-route doesn't just cause a breakdown, it triggers a product loss event and a potential FDA FSMA violation. Every 1% improvement in PM compliance for refrigerated assets reduces emergency cold-chain breakdowns by 3–4%, because reefer unit failures are disproportionately catastrophic compared to drivetrain failures.
Food Fleet Industry Average71%
FleetRabbit Customers (avg)95%
Target96%+
Hour-based vs calendar-basedHour-based improves compliance 28–38%
FleetRabbit tracks both truck drivetrain and reefer unit PM schedules on separate hour-based intervals — not calendar estimates that miss high-run cold chain periods. Overdue PMs escalate through automated alerts to fleet manager, operations supervisor, and food safety coordinator. Reefer unit PMs are prioritised with a separate compliance dashboard because cold chain impact of reefer failures outweighs standard drivetrain downtime.
6. Cold Chain Downtime & Product Loss Impact
Downtime in food distribution fleets carries a dual cost: lost delivery capacity plus potential product write-off. A refrigerated trailer breakdown mid-route can result in $500–$3,500 per hour in combined operational loss and product spoilage risk. Most food fleet operators cannot quantify their cold chain downtime costs accurately because they don't connect equipment downtime records to product loss events. FleetRabbit closes that gap automatically.
Food Fleet Industry Average84%
Best-in-class95%+
Planned vs Unplanned Target85/15 ratio
Combined downtime cost$500–$3,500/hour
FleetRabbit logs every downtime event with category (reefer failure, drivetrain breakdown, scheduled PM, dock delay), duration, affected load status, and estimated cost impact. Monthly reports surface the top-5 cold chain downtime causes with financial quantification. The planned-vs-unplanned ratio reveals whether your refrigerated fleet maintenance strategy is truly proactive — or reactive and product-loss-prone.
7. Driver Compliance & Cold Chain Behaviour Metrics
Driver behaviour in food distribution fleets directly affects cold chain integrity, fuel costs, and regulatory compliance — but without tracking, fleet managers have no visibility into which drivers are creating temperature risks through door discipline failures, setpoint overrides, or improper pre-cooling procedures. FleetRabbit tracks driver-level cold chain metrics that enable coaching, accountability, and FSMA documentation in a single system.
Pre-trip inspection completionPer driver trending
Temperature setpoint complianceOverrides logged per driver
Reefer idle time at dockTarget below 25% of route time
Door open event frequencyIdentifies door discipline outliers
FleetRabbit generates driver scorecards for food distribution fleets comparing pre-trip inspection completion rates, reefer setpoint override frequency, dock idle time, and door-open event counts across drivers on the same routes and equipment types. Scorecards enable data-driven coaching, support FSMA driver training documentation requirements, and recognise drivers who consistently protect cold chain integrity.
8. Total Cost of Ownership for Refrigerated Assets
TCO for refrigerated trucks and trailers is more complex than standard fleet assets because it must account for two parallel cost streams: the truck drivetrain and the reefer unit. A refrigerated trailer that appears cost-effective on drivetrain metrics alone may be haemorrhaging money through reefer repairs, excessive fuel consumption, and product loss events linked to ageing refrigeration equipment. True TCO combines both streams into a single replacement decision framework.
Optimal replacement — reefer unitWhen reefer repair cost/yr exceeds 35% of unit value
Typical crossover — refrigerated trailer10–14 years / 600K–900K miles
FleetRabbit trackingAutomatic dual-stream TCO per asset
Replacement alertTriggered when TCO exceeds fleet average by 30%
FleetRabbit aggregates truck drivetrain costs and reefer unit costs separately, then combines them into a unified TCO figure per asset. Reefer repair costs flow in from work orders, reefer fuel from consumption logs, and depreciation from asset value settings. When a refrigerated asset's combined TCO exceeds the fleet average by 30%, a replacement alert is triggered — enabling data-backed CAPEX requests grounded in real operational cost history rather than age assumptions.
From the Field
"Our biggest pain point was connecting reefer performance data to product loss events. We knew we were having temperature excursions, but we couldn't prove which assets were causing them or what they were costing us until the claims came in. FleetRabbit gave us a real-time dashboard showing cold chain compliance, reefer PM status, and temperature excursion history across our 85-unit refrigerated fleet. In the first six months, we reduced product loss claims by 34% and cut reefer repair costs by 19% — because we finally knew which units were failing before they failed on a loaded route."
Director of Fleet Operations
·
Regional Food Distributor — 85 Refrigerated Assets — 4 Distribution Centres
Frequently Asked Questions
QDoes FleetRabbit integrate with reefer unit telematics systems like Thermo King and Carrier?
FleetRabbit integrates with major reefer telematics providers to pull temperature logs, run hours, fuel consumption, and alarm events directly into the fleet analytics dashboard. Contact the FleetRabbit team to confirm your specific reefer unit compatibility during the demo.
QCan FleetRabbit generate FSMA-compliant temperature records automatically?
Yes. FleetRabbit logs temperature data per load with timestamps, asset ID, setpoint vs. actual readings, and excursion events — formatted for FDA Sanitary Transportation of Human and Animal Food compliance documentation. Reports can be exported on demand or scheduled for automatic delivery.
QHow quickly does cold chain utilisation data become available after setup?
Basic utilisation, PM compliance, and inspection reporting are available within the first week after telematics integration. Full cold chain TCO reporting and excursion trend analysis require 60–90 days of data accumulation for meaningful benchmarking and anomaly detection.
QCan different users — dispatchers, food safety managers, and executives — see different reports?
Yes. FleetRabbit's role-based access controls let you configure exactly what each user sees. Food safety managers see temperature compliance and excursion reports; dispatchers see route utilisation and availability; executives see fleet-wide TCO and cost intelligence summaries — all from the same live data.
FleetRabbit Cold Chain Analytics
Stop Losing Product. Start Controlling Your Cold Chain.
FleetRabbit automates every refrigerated fleet metric — utilisation, reefer-to-engine ratios, temperature compliance, PM compliance, cold chain downtime, driver behaviour, reefer fuel efficiency, and dual-stream TCO — with real-time dashboards and scheduled delivery to your team.
Food Fleet Utilization
Refrigerated Fleet Analytics
Cold Chain Utilization
Reefer PM Compliance
Driver Scorecards
TCO Reports
May 21, 2026
By Taylor
All Posts