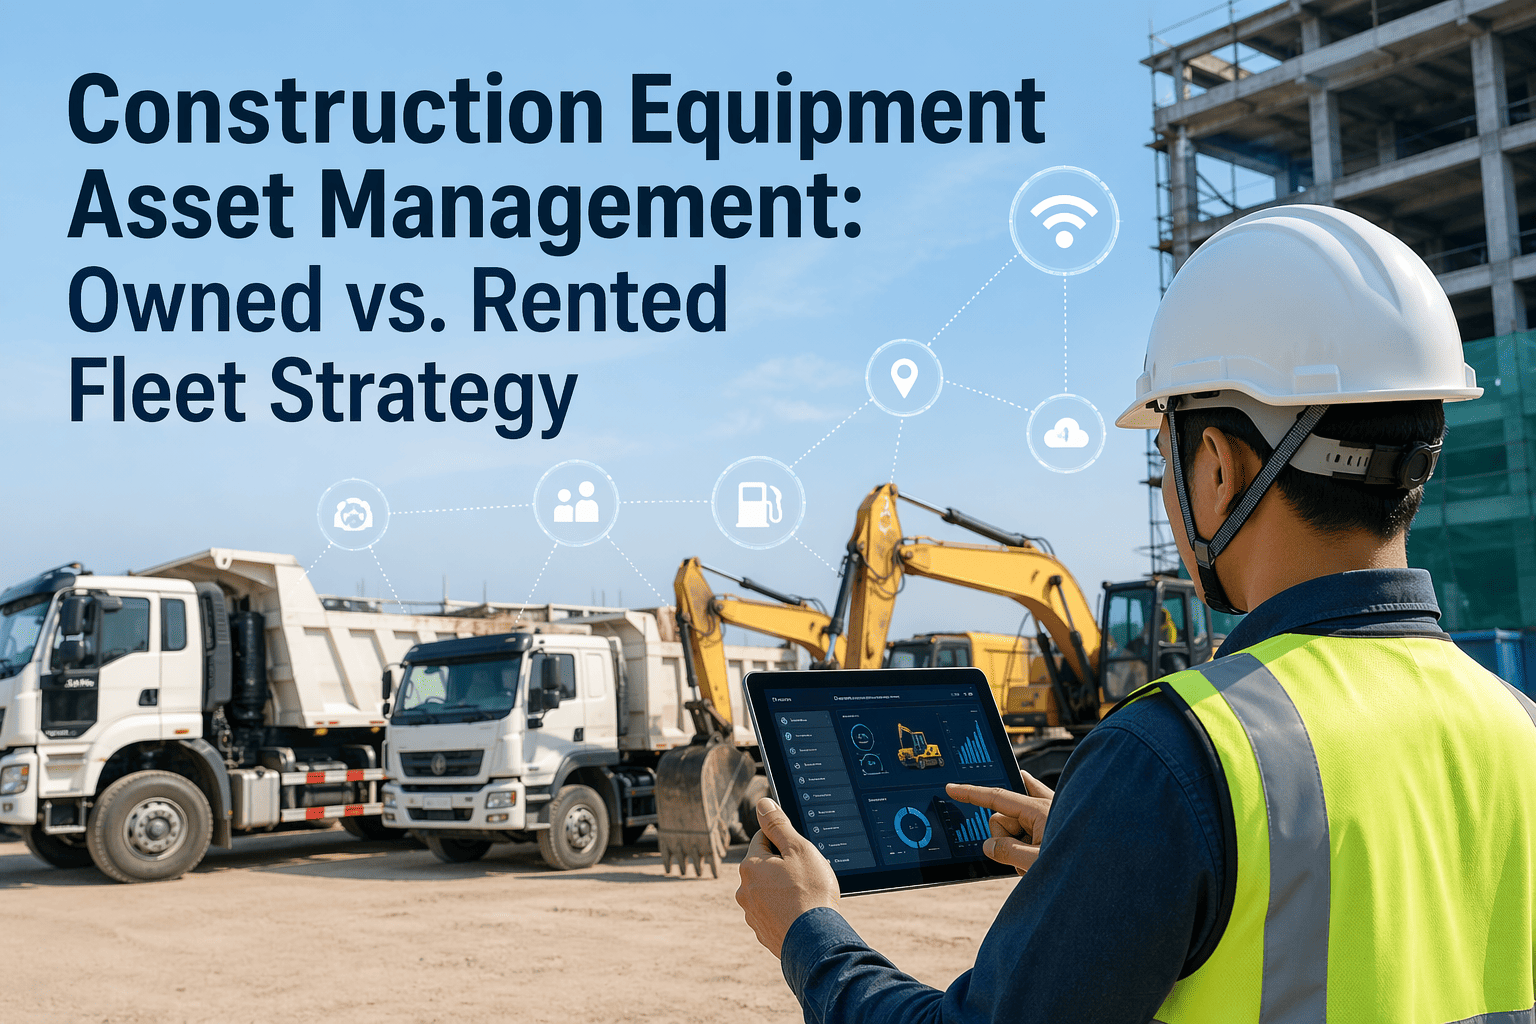
The owned versus rented equipment decision is one of the highest-value strategic choices a construction fleet director makes — and it is one of the most frequently made on incomplete data. Most construction businesses default to ownership for high-utilisation assets and rental for short-term requirements, but without utilisation monitoring at the asset level, the word "high-utilisation" is a guess rather than a measurement. The result is a common pattern: owned equipment that sits at 38% utilisation generating full depreciation and maintenance cost while the project director rents identical machines at premium rates for adjacent sites because no one has the cross-site visibility to know owned capacity is available. This article provides a complete decision framework for construction equipment asset management — covering the total cost of ownership calculation, the utilisation thresholds that should drive own-vs-rent decisions, the lifecycle management process that maximises residual value, and how FleetRabbit's real-time asset data gives fleet managers the information they need to make every one of these decisions on evidence rather than instinct. Book a strategy session to analyse your fleet's owned vs. rented asset mix.
FleetRabbit Asset Intelligence
Construction Equipment Asset Management: Owned vs. Rented Fleet Strategy
A complete decision framework for construction fleet directors — covering total cost of ownership calculations, utilisation thresholds for own-vs-rent decisions, lifecycle management, and the data infrastructure needed to optimise your asset mix continuously.
When to Own
When to Rent
TCO Calculation
Lifecycle Management
Data-Driven Decisions
The Strategic Framework — Five Variables That Determine Own vs. Rent
No single rule determines whether an asset should be owned or rented. The decision is a function of five measurable variables — and crucially, all five must be actively monitored on an ongoing basis, not assessed once at acquisition and forgotten.
01
Projected Annual Utilisation Rate
The single most determinative variable. An asset consistently achieving 65%+ utilisation (of available operating hours) will almost always be cheaper to own than rent over a 3-year horizon. Below 45% utilisation, rent economics typically outperform ownership when total cost of ownership is properly calculated including depreciation, financing, maintenance, and insurance. The 45–65% band requires a detailed TCO comparison.
Own threshold: ≥65% utilisation | Rent threshold: ≤45%
02
Asset Type Flexibility Requirement
Equipment with a single dominant use case that your programme will require consistently (e.g., excavators on an infrastructure portfolio) favours ownership. Equipment used for specialist tasks that appear unpredictably in the project programme — vibro-hammer rigs, tunnel boring equipment, specialist lifting configurations — favours rental where the cost of idle periods between specialist uses makes ownership uneconomic regardless of utilisation when used.
Own: consistent use case | Rent: specialist / unpredictable demand
03
Programme Duration & Pipeline Visibility
Ownership economics require at least 3 years of programme to recover acquisition costs — most heavy equipment reaches optimal cost-per-hour ownership economics at years 3–5 before maintenance costs begin rising. If your construction programme visibility is under 24 months for a specific asset type, rental often provides better economics with lower balance sheet exposure and zero asset disposal risk.
Own: 3+ year programme | Rent: under 24 months visibility
04
Technology Cycle & Specification Risk
Equipment technology is evolving rapidly in emission-controlled engines, telematics, and operator assistance systems. Owning Stage V equipment purchased in 2022 carries a residual value risk if Stage VI requirements or hybrid/electric mandates accelerate faster than expected. For categories undergoing significant technology change, rental eliminates specification obsolescence risk entirely.
Own: stable technology | Rent: rapidly evolving specifications
05
Fleet Management Capability & Infrastructure
Owned equipment requires maintenance scheduling, operator management, compliance tracking, insurance management, and asset disposal capability. Without a fleet management system capable of tracking all these elements, owned fleet costs escalate through missed maintenance events, compliance penalties, and unmanaged asset lifecycle. Rental eliminates this overhead — and the decision to own should include honest assessment of whether the management infrastructure is in place to extract ownership economics.
Own: FleetRabbit or equivalent platform active | Rent: if management system absent
06
Decision Review Frequency — How Often to Reassess
The five variables above are not static — utilisation rates shift as programmes change, technology mandates evolve, and pipeline visibility improves or deteriorates. Fleet managers using FleetRabbit review each asset class's own-vs-rent positioning on a quarterly basis using rolling 90-day utilisation data and updated TCO calculations. Annual strategic reviews align the fleet acquisition plan with the 3-year programme forecast. Ongoing monitoring means decisions adjust proactively rather than reactively.
Review cycle: Quarterly operational + Annual strategic fleet planning
Total Cost of Ownership — The Complete Calculation
The most common error in owned vs. rented analysis is an incomplete TCO calculation that understates ownership cost by excluding depreciation impact, financing cost, and the management overhead that rental eliminates. The calculation below represents the complete ownership cost structure for construction heavy equipment.
Acquisition Costs
Purchase priceFull machine cost including transport, commissioning, and first service
Financing costInterest charges over the financing term — often 4–8% p.a. of financed amount
Registration & taxesVehicle registration, stamp duty, and any import taxes — varies by jurisdiction
Annual Operating Costs
Fuel consumptionLitres/hour × operating hours × fuel price — tracked in FleetRabbit per machine
Scheduled maintenanceService intervals × parts and labour cost — typically $12–$24 per operating hour
Unplanned repairsAverage 22–38% of scheduled maintenance cost in years 1–3; rising in years 4–7
InsuranceTypically 1.5–2.5% of machine value annually for construction equipment
Tyres / undercarriageMajor cost centre for wheeled machinery and crawler equipment — $8,000–$60,000 per rebuild cycle
Overhead & Management Costs
Fleet management labourFleet manager time allocated to this asset class — scheduling, compliance, reporting
Fleet management systemPro-rata platform cost (FleetRabbit or equivalent) per managed asset
OSHA compliance costInspection management, certification maintenance, audit preparation per asset
Storage & transportLay-down yard cost, low-loader mobilisation between sites, site access preparation
Depreciation & Disposal
Annual depreciationTypically 15–22% diminishing value per year for heavy construction equipment
Residual value riskMarket value at disposal vs. book value — varies by equipment type, condition, and market
Disposal costAuction fees, transport, decommissioning — typically 3–8% of disposal proceeds
Underutilisation costFull fixed cost continues accumulating during periods asset is not working — often excluded from TCO then encountered as a surprise
FleetRabbit Asset Analytics
Know Your Real Cost Per Operating Hour — For Every Asset
FleetRabbit tracks actual fuel consumption, maintenance spend, idle time, and utilisation for every owned asset — giving fleet managers the real-time TCO data needed to make accurate own-vs-rent decisions based on what the asset actually costs rather than what it was budgeted to cost.
65%+Utilisation — ownership typically wins
45%Utilisation — detailed TCO comparison required
<45%Utilisation — rental typically wins
3–5yrOptimal ownership cost window
The Utilisation Data Problem — Why Most Fleets Get the Decision Wrong
The owned vs. rented decision is only as good as the utilisation data underpinning it. Most construction fleet managers who make ownership decisions based on estimated or intuition-based utilisation consistently overstate how much their equipment is actually working — and understate idle and standby time. The gap between perceived and actual utilisation in construction fleets averages 19 percentage points.
Without FleetRabbit — Estimated Data
Fleet manager estimates equipment is working 70% of available hours based on site supervisor feedback
No visibility of idle time — engine-on hours counted as productive time even during lunch breaks and extended warmups
Cross-site availability unknown — one site renting machines while adjacent site's identical owned assets sit idle
Ownership decisions made on instinct or previous experience — sometimes correct, often not
Actual utilisation typically 38–51% vs. perceived 60–75%
With FleetRabbit — Measured Data
Real-time utilisation measured from telematics — productive hours, idle hours, and standby hours tracked separately
Idle time monitored per machine — alerts trigger when idle exceeds threshold, operators coached on shutdown discipline
Portfolio-wide availability dashboard — fleet manager sees every asset's status across all sites simultaneously
Own-vs-rent decisions backed by actual 12-month utilisation history per asset class and per site
Redeployment opportunities identified automatically — idle asset matched to adjacent site hire requirement
Lifecycle Management — Maximising Owned Asset Value
For assets where ownership is the correct decision, lifecycle management determines whether the ownership economics that justified purchase are actually realised in practice. Poor lifecycle management — missed services, unmanaged depreciation timing, and delayed disposal — can turn a sound ownership decision into a cost overrun.
Years 1–2
Optimise New Asset Deployment
New equipment has lowest maintenance cost and highest reliability — deploy to highest-utilisation sites and most demanding work programmes. Capture baseline consumption and performance data in FleetRabbit during this period to establish benchmarks against which future degradation is measured. Ensure warranty maintenance schedules are followed precisely and warranty claims are processed for any manufacturing defects.
FleetRabbit action: Set baseline performance benchmarks. Configure warranty maintenance triggers.
Years 3–5
Peak Value Window — Maximum Utilisation
Years 3–5 represent the optimal ownership economics window — purchase financing is typically complete or nearly so, major maintenance events are manageable, and the machine is still performing in the upper range of its productive life. This is the period to maximise utilisation, drive down cost-per-hour through high deployment, and use FleetRabbit consumption data to schedule maintenance predictively rather than reactively.
FleetRabbit action: Usage-based PM triggers. Consumption trending. Cross-site deployment optimisation.
Years 5–8
Monitor Maintenance Cost Trajectory
Maintenance cost per operating hour begins rising after year 5 for most heavy construction equipment. FleetRabbit's cost-per-hour tracking enables the fleet manager to monitor the exact point at which maintenance cost crosses the threshold where a new machine or rental alternative becomes more economical. Without this data, the decision is delayed by instinct until a major repair event forces action — typically at the worst possible time in the programme.
FleetRabbit action: Monthly cost-per-hour report. Maintenance cost trending. Replacement threshold alerts.
Disposal Decision
Dispose Before Value Drops — Not After
The optimal disposal point for owned construction equipment is before the major maintenance event, not after. A machine sold at year 6 with anticipated but not-yet-executed major works (undercarriage rebuild, engine overhaul) retains significantly more value than the same machine sold post-event at year 7 — when the market discounts heavily for age. FleetRabbit's maintenance history export provides buyers with documented service records that command a price premium at auction or private sale.
FleetRabbit action: Generate maintenance history export for sale. Calculate optimal disposal timing from cost data.
When Rental Is Definitively the Better Choice
Rent
Specialist Equipment with Infrequent Demand
Vibro-hammer rigs, specialist concrete pumping configurations, long-reach excavator attachments, and similar equipment used intensively for 2–6 weeks and then not required for the remainder of the programme. Ownership economics are irretrievably negative at <20% annual utilisation. Rental gives access to the exact specification needed at the exact time it's needed.
Rent
Emergency or Surge Capacity Requirement
Programme acceleration events, unexpected breakdown coverage, and peak production periods where owned capacity is fully deployed represent ideal rental scenarios. FleetRabbit's cross-site utilisation data identifies the exact gap between owned capacity and programme demand — giving the fleet manager the information to source rental on a planned basis rather than paying emergency premium rates at the last minute.
Rent
Technology Transition Periods
When emission regulations, operator assistance requirements, or client specifications are about to change significantly within the programme horizon, rental freezes your specification risk. Renting Stage V equipment that will be replaced by a Stage VI specification in 18 months avoids owning a machine that either requires capital conversion or faces a depressed residual value at the exact point you plan to sell it.
Rent
Markets with High Volatility or Limited Pipeline
For construction businesses in high-volatility markets where a 12-month programme forecast is uncertain, rental preserves capital, eliminates asset disposal risk, and keeps fleet costs variable rather than fixed. The option value of being able to scale down without asset write-off is significant — and represents a genuine financial hedge that ownership cannot provide.
How FleetRabbit Optimises Owned vs. Rented Fleet Mix Continuously
01
Real-Time Utilisation Visibility Across Every Site
FleetRabbit provides a single cross-site view of every owned asset's utilisation status — available hours, engine-on hours, productive hours, and idle hours — updated in real time. Fleet managers identify underutilised owned assets and match them to active hire requirements on other sites before contacting a rental yard. Redeployment instead of rental saves $700–$900/day per event.
02
12-Month Utilisation History — Own vs. Rent Decision Data
Every asset's utilisation rate is tracked historically in FleetRabbit — enabling fleet managers to produce 12-month rolling utilisation reports per asset class, per site, or across the entire portfolio. When a rental-vs-purchase decision is made, it is informed by what the same asset class actually achieved in utilisation over the prior year on your programmes — not an optimistic projection.
03
Maintenance Cost-Per-Hour Tracking for Lifecycle Decisions
FleetRabbit tracks cumulative maintenance spend per asset and calculates cost-per-operating-hour automatically — enabling the fleet manager to monitor the cost trend over the asset's life and identify the disposal trigger point before maintenance costs make the ownership economics negative. This single data point prevents the single most common owned-fleet cost overrun: holding aging equipment past its economic life.
04
Rental Fleet Tracking — Owned and Rented in One System
FleetRabbit manages both owned and rented assets in a single platform — tracking each rental asset's usage against the hire agreement, flagging unused rental assets that should be returned to avoid hire cost accumulation, and maintaining inspection and compliance records for rented equipment that the fleet manager is responsible for while on-site. Mixed owned/rented fleets are fully supported without requiring separate management systems.
From the Field
"Before FleetRabbit, we made ownership decisions based on how busy the machines seemed on site. We thought our excavator fleet was running at around 70% utilisation — the site supervisors said the machines were always working. When we connected FleetRabbit to the fleet, the actual productive utilisation across our 14 excavators was averaging 48%. We had four machines below 35% over the previous year — and we'd just approved purchase of two additional units in the same class. We immediately redirected those planned purchases to rental for the next programme cycle and redeployed two of the underperforming owned assets to a site that had been hiring machines weekly. Inside 6 months we'd saved $340,000 in avoided purchase cost and $82,000 in external hire. That's the conversation FleetRabbit data enables — not guessing, not site supervisor opinion, actual hours across actual machines."
Chief Operating Officer
·
National Civil Contractor — 94 Owned Assets — 11 Active Sites
Frequently Asked Questions
QWhat utilisation rate should trigger a review of rented equipment for potential purchase?
A rented asset class consistently achieving 65%+ utilisation across 6 months or more of FleetRabbit data is a strong candidate for a purchase analysis. The calculation should compare 12-month total rental cost (including mobilisation and demobilisation) against the full TCO of ownership for the same period — including financing, maintenance, insurance, and management overhead. If the asset will remain in the programme for 3+ years at that utilisation level, ownership economics are almost always favourable at 65%+ utilisation.
Discuss your specific asset class with our fleet strategy team.
QCan FleetRabbit track rented equipment as well as owned assets?
Yes. FleetRabbit manages rented assets as a distinct asset category with the hire agreement end date, daily hire cost, and usage tracking all configured per asset. Fleet managers can see exactly how much each rented machine is costing per operating hour and receive alerts when a rental asset is underutilised — enabling timely return decisions that eliminate redundant hire cost. Inspection and compliance records for rented equipment are maintained in FleetRabbit for the period the equipment is on-site, with clear reporting against the hire term.
QHow does FleetRabbit help identify owned assets that should be sold?
FleetRabbit's maintenance cost-per-hour report tracks cumulative and rolling maintenance spend per asset — enabling the fleet manager to identify assets where maintenance cost is trending above the economic threshold for the asset class. When an owned asset's maintenance cost per operating hour approaches or exceeds the rental rate for equivalent capacity, the disposal analysis is triggered. FleetRabbit generates a complete maintenance history export for any asset — including all service records, defect histories, and resolved repair events — a document that adds demonstrable value at auction or private sale by evidencing the asset's maintenance standard.
QHow quickly does utilisation data become reliable enough to make ownership decisions?
FleetRabbit produces meaningful utilisation trend data within 30 days of telematics connection — giving a real-time baseline for immediate operational decisions. For significant capital decisions (purchase vs. continued rental), we recommend a minimum 90-day data set to account for programme seasonality and activity variation. Ideally, a 6–12 month data series is used for purchase decisions, with the rolling 12-month utilisation rate forming the basis of the TCO comparison. FleetRabbit's trial period allows fleet managers to begin building this data set immediately.
Start your free trial and begin capturing utilisation data today.
FleetRabbit Asset Intelligence Platform
Make Every Own-vs-Rent Decision on Real Data — Not Instinct
FleetRabbit gives construction fleet directors the utilisation history, cost-per-hour data, cross-site visibility, and lifecycle cost analysis needed to make intelligent asset mix decisions — eliminating the guesswork that results in underutilised owned assets and unnecessary rental spend occurring simultaneously across the same fleet.
Real-Time Utilisation Tracking
Cost-Per-Hour Analysis
Owned + Rental in One System
Lifecycle Disposal Timing
12-Month Utilisation History
April 22, 2026
By Michael
All Posts