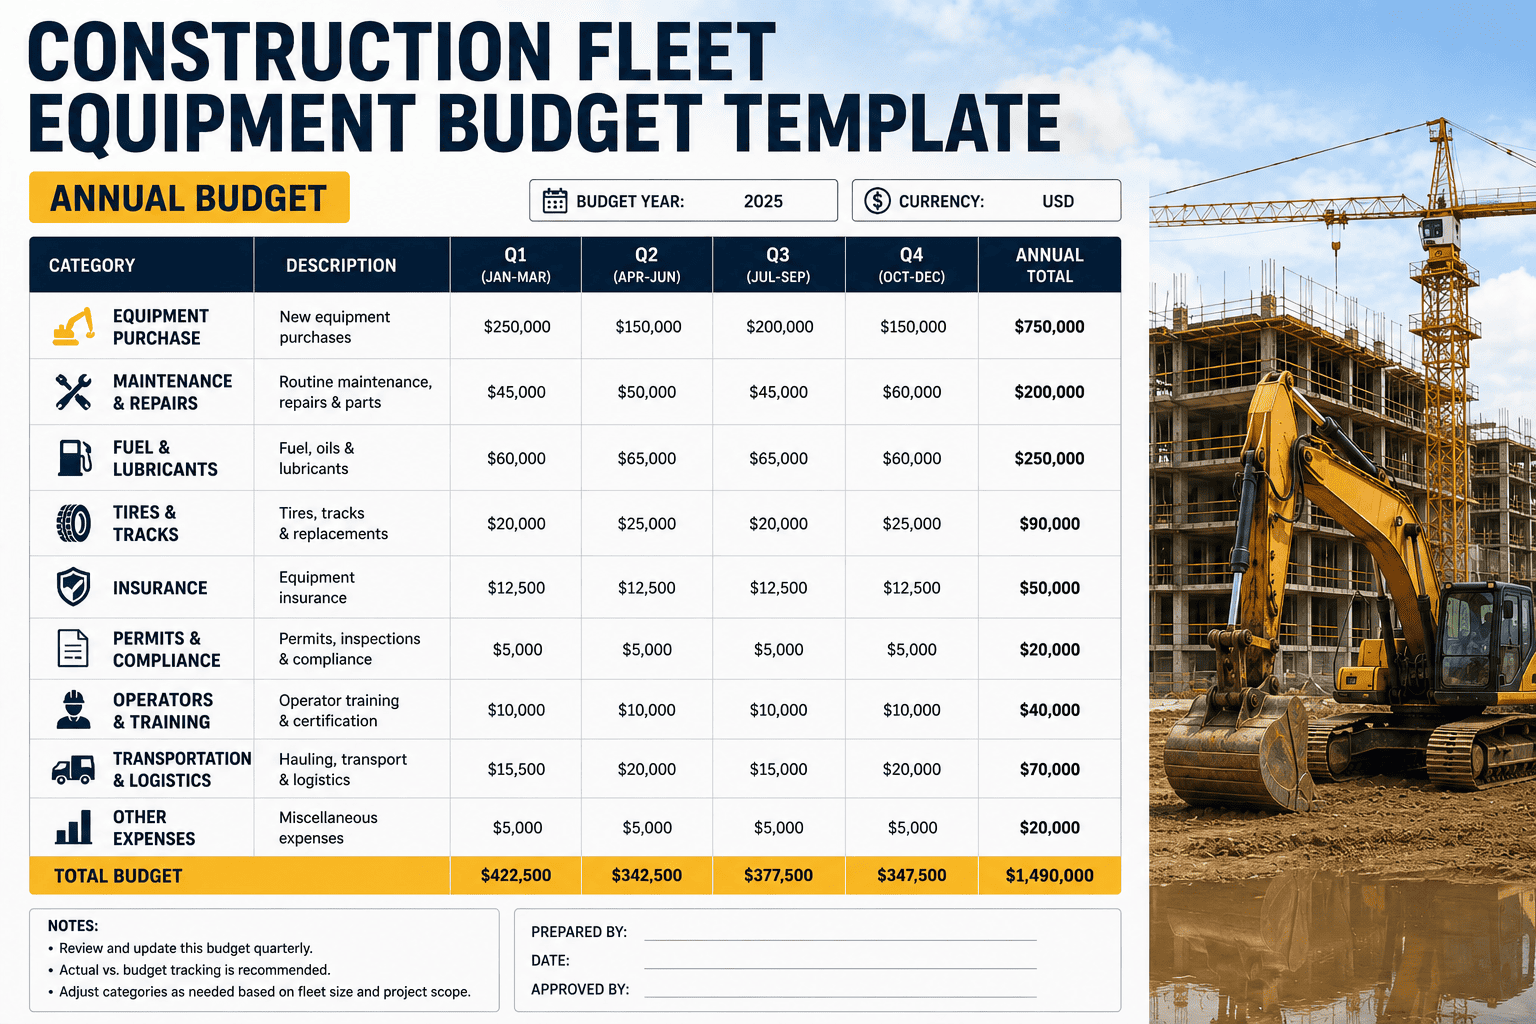
Every construction fleet budget looks solid in January and falls apart by August. Fuel prices tick up, a dozer needs an unplanned undercarriage rebuild, and a rental gap you did not plan for eats the contingency line before the third quarter even starts. The problem is rarely bad intentions. It is a budget built from memory and last year's number instead of real cost data pulled from the machines themselves. A working annual equipment budget needs the right categories, realistic ranges, and a way to compare planned spend against actual spend before the gap becomes a crisis.
A construction fleet equipment budget should cover six core categories: preventive maintenance, emergency repairs and major rebuilds, fuel and fluids, tires and undercarriage wear, short-term rentals, and insurance plus a contingency reserve. Most well-run fleets allocate roughly 30 to 35 percent to fuel, 25 to 30 percent to maintenance and repairs, and the remainder split across rentals, tires, insurance, and a 5 to 10 percent contingency buffer. FleetRabbit pulls real engine-hour, fuel, and repair data from your fleet so every category is built on actuals instead of guesswork.
The Six Line Items Every Equipment Budget Needs
A construction equipment budget is only as strong as its categories. Lump maintenance and fuel into one vague "operating costs" line and you lose the ability to spot which category is actually driving overruns. Break the budget into these six groups instead, and track each one separately from day one.
Fuel and Fluids
Diesel, DEF, hydraulic fluid, and lubricants. Usually the single largest line item, and the most sensitive to idle time and market price swings.
Preventive Maintenance
Scheduled PM-A, PM-B, and PM-C services across the fleet, based on manufacturer intervals and actual engine hours logged per machine.
Emergency Repairs and Rebuilds
Unplanned breakdowns, hydraulic pump failures, and major component rebuilds such as final drives or undercarriage replacement.
Tires and Undercarriage
Tire replacement, track pads, chain and sprocket wear, and drum shell wear on rollers and compactors.
Rentals and Temporary Equipment
Short-term rentals to fill capacity gaps, cover breakdowns, or handle peak-season project spikes without buying new equipment.
Insurance and Contingency
Premiums, permits, and a reserve fund for the unplanned events every fleet eventually runs into, typically 5 to 10 percent of the total budget.
Building Your Annual Budget in Five Steps
Pull the Last 12 to 24 Months of Actuals
Start with real fuel, maintenance, and repair data per machine, not a rough annual estimate. Two years of history smooths out one-off repair spikes and shows the true cost trend.
Segment by Asset Type and Utilization
An excavator running 1,800 hours a year costs differently than one sitting idle most of the season. Group machines by usage rate before applying cost assumptions.
Apply the Six Categories Above
Assign a percentage or dollar range to each of the six line items per asset, adjusted for age, duty cycle, and any known price changes for fuel or parts.
Build In a Contingency Reserve
Set aside 5 to 10 percent of the total budget for the breakdowns, weather delays, and price spikes that every fleet eventually absorbs.
Review Monthly, Not Just Annually
A budget built once in January and never revisited is a forecast, not a management tool. Compare actual spend to planned spend every month and flag any category running more than 10 percent over.
Where Most Construction Equipment Budgets Break Down
The most common budgeting mistake is not underestimating a single number, it is treating every machine the same way regardless of how hard it actually works. A fleet that budgets fuel and maintenance as a flat per-machine average ends up over-budgeting idle equipment and under-budgeting the machines carrying the heaviest workload, which is exactly where breakdowns show up first.
The fix is tying the budget to live utilization data
When engine hours, fuel burn, and repair history are tracked automatically per machine, the next year's budget writes itself from actuals instead of guesswork. That is the gap FleetRabbit is built to close.
FleetRabbit tracks fuel, maintenance, repairs, and utilization per machine automatically, so your annual budget is built on actuals instead of last year's guesswork. Sign up free to connect your fleet data, or book a demo to see a live budget breakdown for your equipment list.
Sample Annual Budget Worksheet
Use the ranges below as a starting worksheet for a mid-size construction fleet, then adjust for your own historical actuals and regional pricing.
| Budget Category | % of Total Budget | Primary Cost Drivers | Best Data Source |
|---|---|---|---|
| Fuel and Fluids | 30-35% | Diesel price, idle time, engine hours | Fuel card and telematics history |
| Preventive Maintenance | 15-18% | PM-A/B/C frequency, labor rates | PM schedule and work order logs |
| Repairs and Rebuilds | 10-15% | Equipment age, duty cycle severity | 12-24 month repair history |
| Tires and Undercarriage | 10-12% | Ground conditions, hours on wear parts | Wear inspection records |
| Rentals | 10-15% | Project pipeline, seasonal demand | Prior-year rental invoices |
| Insurance and Contingency | 8-10% | Premium renewals, unplanned events | Policy renewals plus 5-10% buffer |
Frequently Asked Questions
Stop rebuilding your equipment budget from memory and last year's rough guess. FleetRabbit tracks every dollar across fuel, maintenance, repairs, tires, and rentals so your annual plan is grounded in what your fleet actually costs to run.







