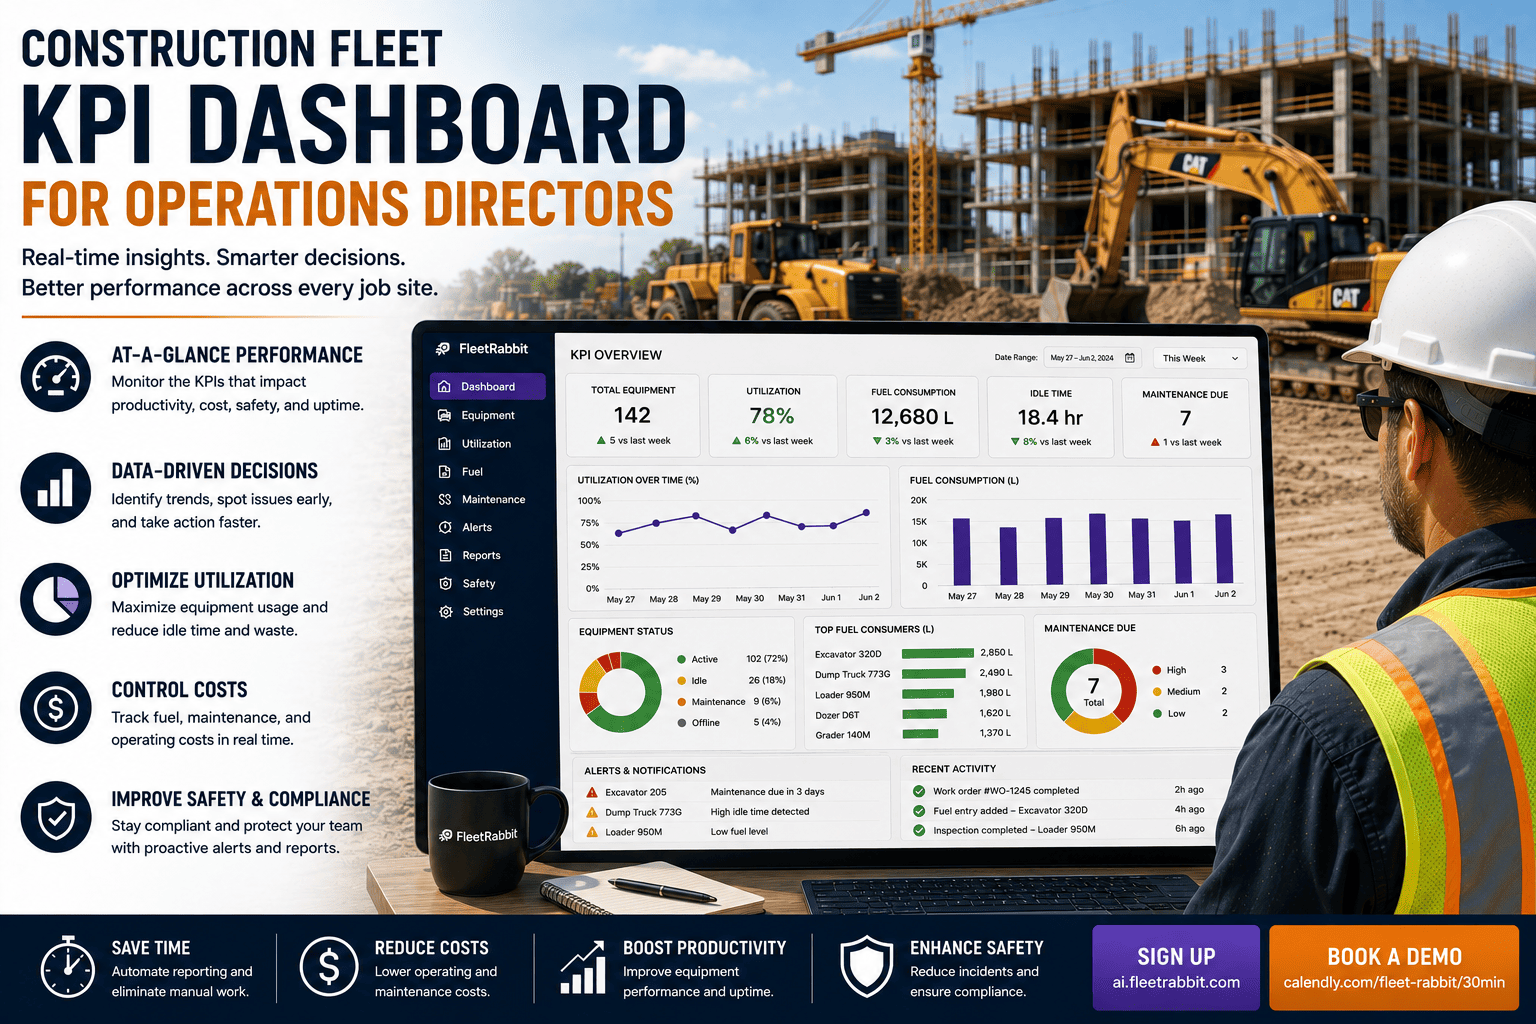
Every construction operations director has lived this moment: a VP asks "how's the fleet doing this quarter?" and the honest answer requires three spreadsheets, a call to the maintenance shop, and a guess. Equipment sits scattered across job sites, telematics data lives in one system, work orders live in another, and fuel receipts live in a shoebox. By the time the numbers are compiled, they are already three weeks stale. The fix isn't more reports. It's fewer numbers, watched constantly, on one screen. A well-built construction fleet KPI dashboard replaces the guesswork with four or five numbers that tell you exactly where money and productivity are leaking, updated in real time instead of once a quarter.
The Four North Star Numbers Every Dashboard Needs
Operations directors who run tight fleets don't stare at thirty metrics. They watch four, and everything else is a drill-down. These four numbers explain most of what's going right or wrong with a construction fleet, and they're the ones FleetRabbit surfaces first on every executive dashboard.
Equipment Utilization Rate
Active engine hours ÷ available hours × 100
Tells you whether the excavator you're paying to own is actually earning its keep on site. Healthy heavy equipment fleets run 75 to 90 percent utilization. Assets consistently below that threshold are quiet candidates for redeployment or sale before they become a fixed cost with no return.
Fleet Availability / Uptime
Hours available ÷ scheduled hours × 100
The percentage of scheduled time equipment is actually ready to work rather than sitting in the shop. Top-performing fleets hold above 95 percent. Anything lower usually points to a maintenance program that's reacting to breakdowns instead of preventing them.
Cost Per Operating Hour
Total operating cost ÷ total operating hours
For heavy, low-mileage equipment, hours matter more than miles. This single figure rolls fuel, maintenance, labor, and downtime losses into one number a project manager can compare across every machine on a job site.
Preventive Maintenance Compliance
PMs completed on schedule ÷ PMs due × 100
The strongest leading indicator of every other metric on this list. Fleets holding 90 percent-plus PM compliance see dramatically fewer breakdowns, lower emergency repair spend, and longer equipment life.
Watch These Four KPIs Update Live
FleetRabbit pulls utilization, uptime, cost per hour, and PM compliance straight from your telematics and work order data, no manual entry required. You can start a free trial and connect your own fleet in under an hour, or if you'd rather see it walked through first, book a live demo with our team.
How To Lay Out A Dashboard An Executive Will Actually Read
Dumping thirty metrics onto one screen with equal visual weight is the fastest way to make an operations director stop opening the dashboard. The metrics that matter should be organized in layers, with the numbers that change strategy shown largest and everything else one click away.
The four north star KPIs, shown large, top of screen
Utilization, uptime, cost per hour, PM compliance. This is what a director should be able to read in under ten seconds walking past a screen.
Six supporting metrics that explain why the north stars moved
Idle time, fuel burn per hour, mean time to repair, deployment ratio by site, open work orders, and overdue inspections.
Everything else, accessible in one click, never forced on screen
Per-asset history, individual work orders, driver behavior logs, and fuel card transaction detail.
Benchmarks By KPI: What Good, Fair, And Concerning Look Like
Numbers only mean something next to a benchmark. Use this table to score your own fleet against the ranges reported across recent construction and heavy equipment fleet studies.
| KPI | Healthy Range | Concerning Signal | What To Check First |
|---|---|---|---|
| Equipment Utilization | 75 to 90 percent | Below 60 percent, or above 90 percent sustained | Redeployment across sites, or breakdown risk from overuse |
| Fleet Availability | Above 95 percent | Below 90 percent | Reactive maintenance pattern, parts sourcing delays |
| Mean Time To Repair | Under 4 hours for critical assets | Above 8 hours | Parts inventory gaps, technician scheduling |
| PM Compliance | 90 percent or higher | Below 75 percent | Calendar-based scheduling instead of engine-hour based |
| Fuel Cost Share | 15 to 25 percent of operating cost | Rising trend on same asset, same workload | Idle time, developing engine issues, fuel card misuse |
Getting From Spreadsheets To A Live Dashboard
Most fleets don't need to overhaul their operation to get here. They need three deliberate steps, usually completed inside a single quarter.
Audit what you already have
Pull 12 months of maintenance records, fuel logs, and telematics exports. Most operations directors are surprised their real cost per hour is 20 to 40 percent higher than the figure they've been reporting upward.
Connect the data sources
Telematics, work orders, fuel cards, and inspection logs feed one platform instead of four disconnected ones. FleetRabbit typically completes this integration in two to six weeks depending on existing systems.
Watch the north stars, weekly not quarterly
Once live, most operations teams catch their first meaningful save, an overdue PM, an underused excavator, a fuel anomaly, within the first thirty days of watching the dashboard.
Why This Matters More For Construction Than Any Other Fleet Type
A delivery van sitting idle for an hour is an inconvenience. An excavator sitting idle on a job site with a crew waiting on it is a stalled project, a missed milestone, and sometimes a penalty clause. Construction fleets carry higher asset values, higher downtime cost per hour, and less tolerance for surprise breakdowns than almost any other sector. That's exactly why the four north star KPIs above deserve to be watched daily rather than reviewed at month end.
What changes once the dashboard is live
Operations directors typically report three shifts within the first quarter: maintenance conversations move from "why did it break" to "when is it due," equipment purchase decisions get backed by real utilization data instead of gut feel, and project managers stop calling the shop to ask if a machine is ready, because they can already see it on the dashboard.
Put Your Fleet On One Screen
Ready to trade spreadsheets for a live view of utilization, uptime, cost per hour, and PM compliance? You can sign up and connect your first machines free today, or book a 30 minute demo and we'll build the dashboard around your actual fleet on the call.
Frequently Asked Questions
Stop Reporting Fleet Performance. Start Watching It.
Every week spent compiling spreadsheets is a week decisions get made on stale numbers. FleetRabbit turns utilization, uptime, cost per hour, and PM compliance into one live dashboard your whole team can trust.







