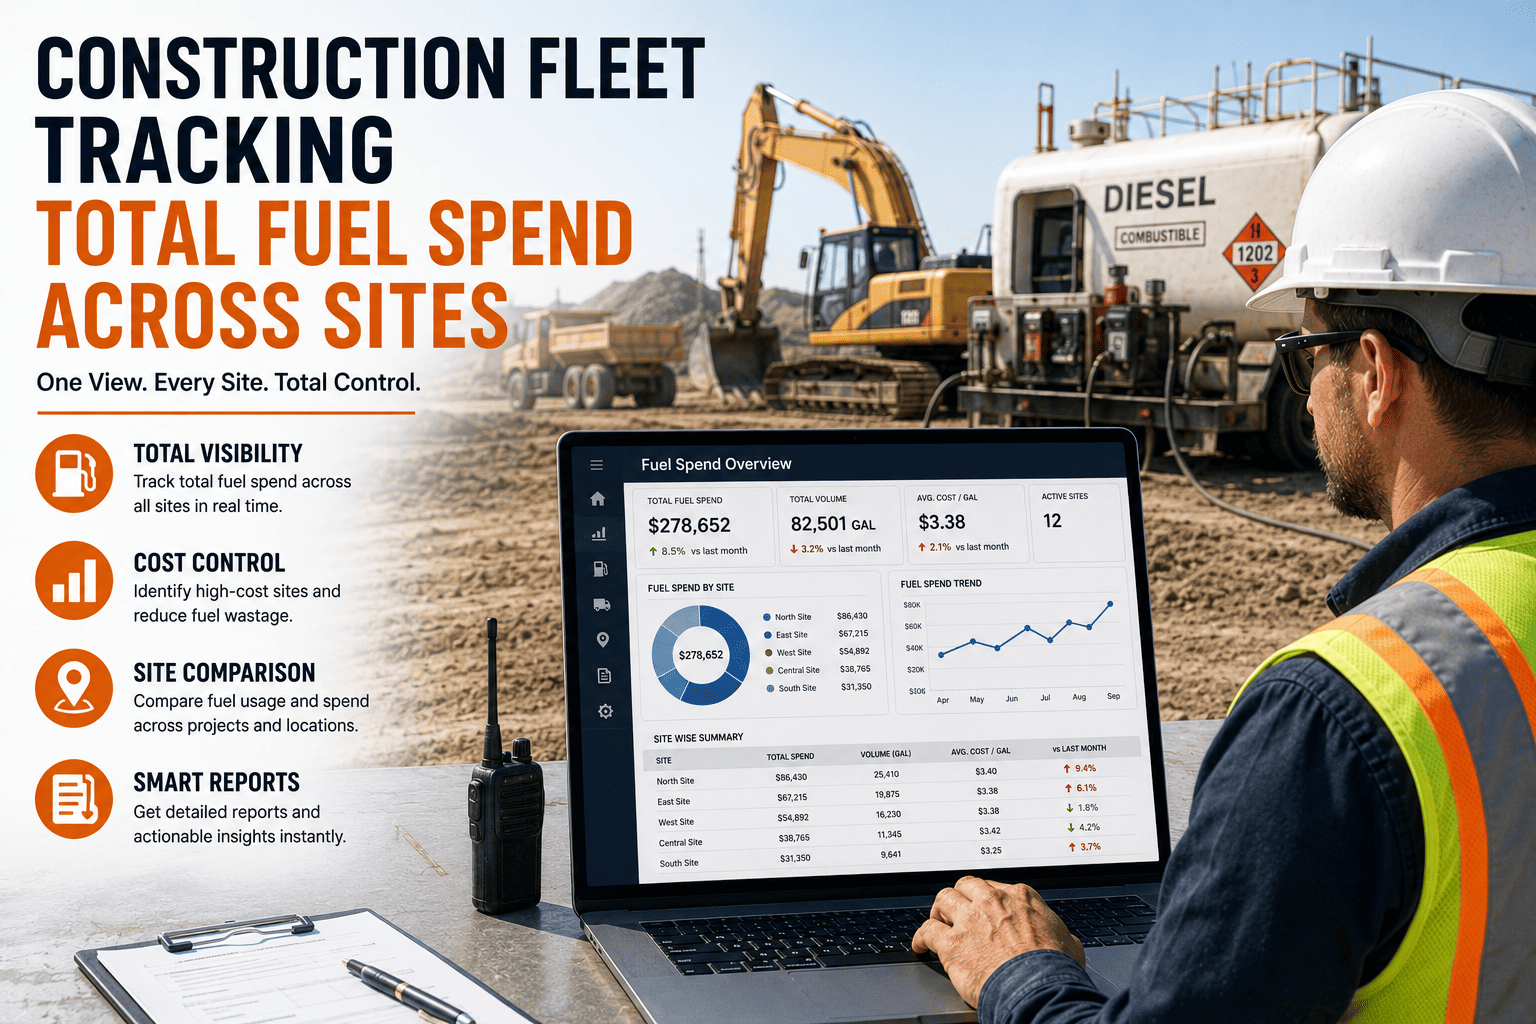
Ask a contractor what fuel costs them last month and you'll usually get three different numbers: one from the fuel card statement, one from the bulk tank supplier invoice, and one somebody guessed based on how many times the delivery truck showed up. None of them match, and none of them tell you which site, which machine, or which crew actually burned through the budget.
Fuel typically eats up 20 to 30 percent of a construction fleet's operating costs, and nearly 42 percent of heavy equipment operating costs specifically. Most contractors track it in three disconnected places, fuel cards, bulk tank invoices, and equipment logs, which hides 6 to 15 percent of total fuel spend to waste, theft, or misallocation. A single consolidated fuel dashboard closes that gap and shows exactly where every gallon and every dollar went, by site and by machine.
Why Your Fuel Spend Never Adds Up
Construction fuel spend rarely lives in one place. A job site might run a bulk diesel tank for excavators and dozers, fuel cards for pickups and delivery trucks, and auxiliary tanks for generators, all billed on different schedules by different vendors. Fuel comprises nearly 42 percent of machine operating costs for heavy equipment, and companies fuel everything from thirty-dollar auxiliary tank fills to seven-thousand-dollar bulk delivery drops, often without a single report tying it all back to one site.
Four Ledgers, Zero Total
Each of those four sources produces its own paperwork, on its own schedule, in its own format. By the time someone tries to answer "what did fuel cost us on the downtown site last month," the answer requires cross-referencing four separate systems, and most fleet managers simply don't have the hours to do that every week.
The Hidden Leakage Nobody Budgets For
Industry studies estimate that 6 to 15 percent of fleet fuel budgets disappear through theft, fraud, excessive idling, and inefficiency before a single productive mile or bucket of dirt gets moved. On a fleet spending 500,000 dollars a year on fuel, that is 30,000 to 75,000 dollars vanishing with no line item to explain it.
Job Costing Without Real Numbers
Contractors bidding future projects rely on historical fuel cost per site. If that number is a rough estimate instead of a real figure, every future bid inherits the same blind spot, either underpricing jobs and eating the loss or overpricing them and losing the bid.
FleetRabbit pulls fuel card transactions, bulk tank deliveries, and equipment consumption into a single view, so every gallon is tied to a site, a machine, and a cost. Sign up free and see your real fuel number for the first time.
Three Ways Contractors Track Fuel Today
Not every fuel tracking method gives you the same level of visibility. Here is how the three most common approaches actually compare when it comes to seeing your total spend clearly.
| Tracking Method | What It Shows | What It Misses |
|---|---|---|
| Fuel Card Statements Alone | Retail transaction records, location, and driver | Bulk tank spend, equipment-level consumption, per-site totals |
| Bulk Tank Invoices Alone | Delivery volume and cost per drop | Which machine used the fuel, whether consumption matches expected output |
| Manual Spreadsheets | Whatever someone remembered to type in | Real-time visibility, consistency, and any data entered late or incorrectly |
| Consolidated Fuel Dashboard | Every gallon and dollar by site, machine, and vendor in one place | Nothing critical, since every source feeds the same report automatically |
What A Consolidated View Actually Reveals
Once fuel card, bulk tank, and equipment data sit in the same dashboard, patterns show up that were invisible before. A transaction 40 miles from a truck's actual GPS position becomes an instant red flag instead of a line buried in a monthly statement. A fill volume larger than a tank's capacity gets caught the same day, not discovered three months later during a reconciliation nobody had time to do.
Site-Level Cost Per Gallon
Comparing fuel cost per site side by side shows which jobs are running efficient equipment and which ones are quietly burning through budget, information that directly improves how the next bid gets priced.
Vendor And Rebate Comparison
Fuel card rebates typically run 2 to 8 cents per gallon, while bulk purchasing can save 35 to 70 cents per gallon at volume. Without a consolidated view, it's nearly impossible to see whether your current mix of cards and bulk contracts is actually the cheapest option available.
A Simple Test
Pull last month's fuel card total and your last bulk tank invoice side by side. If you can't say within a few percent what your true blended cost per gallon was across both, that gap is exactly what a consolidated dashboard closes.
Getting To One Fuel Number You Can Trust
Consolidating fuel visibility does not require replacing your fuel cards or bulk supplier. It requires connecting the systems you already use into one report.
Connect Every Fuel Source Automatically
Fuel card transactions, bulk tank deliveries, and equipment telematics should all feed the same dashboard without anyone manually re-entering numbers from one system into another.
Match Purchases Against Consumption
Every fill should be checked against GPS location, tank capacity, and expected usage, so a suspicious transaction gets flagged the same day instead of surfacing months later.
Break It Down By Site And Machine
A single company-wide fuel total tells you almost nothing useful. Breaking spend down by job site and by piece of equipment is what actually improves job costing and future bids.
FleetRabbit connects fuel cards, bulk tanks, and equipment consumption data automatically, giving you one trustworthy fuel number instead of three conflicting ones. Book a demo and walk through your own fuel data live.
Three disconnected fuel ledgers will always hide more than they reveal. FleetRabbit brings fuel cards, bulk tanks, and equipment consumption into one dashboard so you always know exactly where every dollar went. Sign up free or book a demo to see your total fuel spend clearly for the first time.







