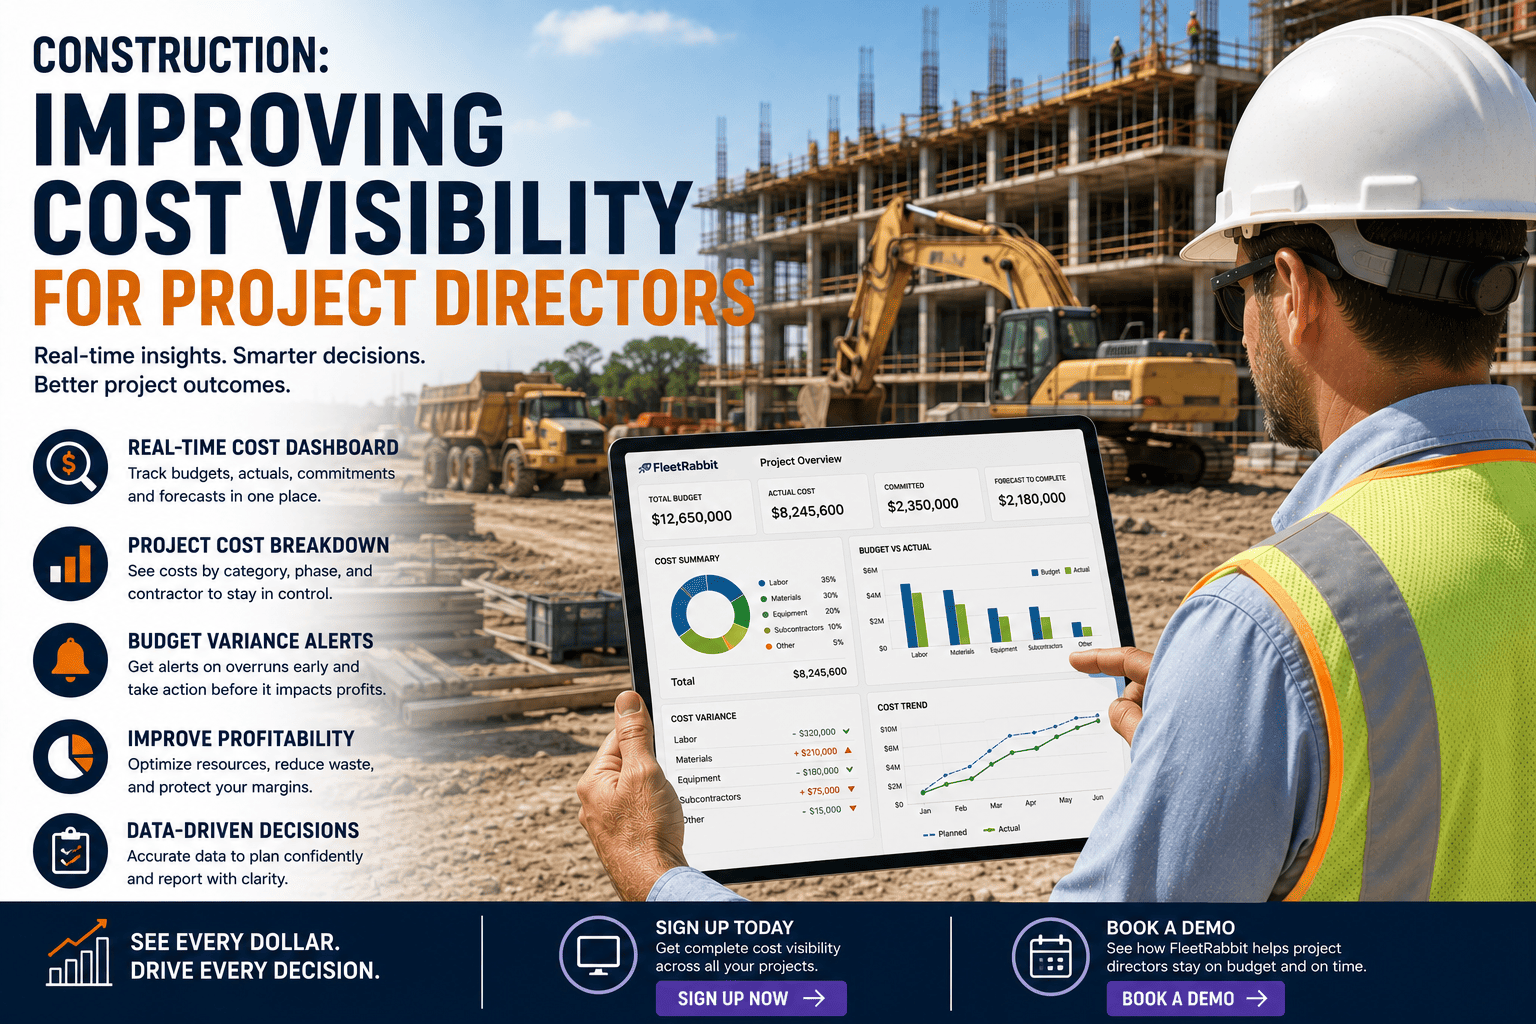
A project director can usually tell you the total budget for a job within a rounding error. Ask the same director what a single excavator actually cost per operating hour last month, on that specific phase, once fuel, maintenance, and idle time are counted, and the answer gets a lot less precise. That gap between knowing the budget and knowing the cost behind it is where profitable projects quietly turn into break-even ones, long before anyone notices on a spreadsheet.
Cost visibility for project directors means seeing equipment, labor, and material costs broken down by project, phase, and operating hour in something close to real time, instead of waiting for a month-end report to explain a number that has already happened. Executive dashboards that pull directly from field and telematics data close that gap and let directors act on cost drift while a project can still be corrected. Sign up free or book a demo to see it built around your projects.
The Real Cost of Not Knowing Costs in Real Time
Most project directors are not short on data. They are short on data that arrives while it still matters. Spreadsheets get updated weekly, invoices get reconciled monthly, and by the time a cost overrun shows up in a report, the phase that caused it is already finished. When schedule, cost, and field reporting live in different tools with different update cycles, teams end up spending meetings reconciling numbers instead of deciding what to do about them, and executives receive polished summaries too late to influence the outcome.
Two Very Different Weeks on the Same Project
- Equipment costs surface in a monthly invoice, weeks after the hours were run
- Idle time and overtime blend into one lump labor number
- A phase runs over budget before anyone can flag it
- Every project reports cost differently, so comparisons take days to build
- Equipment cost per hour updates as the machine runs, not after invoicing
- Idle time, overtime, and productive hours are broken out separately
- Budget drift is visible mid-phase, while there is still time to correct it
- Every project reports through the same structure, so portfolio comparisons take minutes
FleetRabbit turns field and equipment data into dashboards built for project directors, showing cost by project, phase, and operating hour as it happens, not weeks later.
Where the Budget Actually Goes
Cost visibility only helps if it is broken down into categories a director can act on. Construction expenses generally fall into a handful of major buckets, and each one hides its own blind spots if it is only tracked in a lump sum. Labor alone often accounts for close to half of total project cost once payroll taxes, workers' compensation, and benefits are added on top of base wages, and equipment costs carry a similar trap: the invoice shows what was paid, not what was actually burned per productive hour.
| Cost Category | Typical Share of Project Cost | Common Blind Spot Without Visibility |
|---|---|---|
| Labor | 40 to 60 percent of total cost | Base wage tracked, but taxes and benefits that add 35 to 50 percent more go unseen until payroll close |
| Subcontractors | Up to 75 percent of cost for general contractors | Invoices reconciled monthly, so overruns are discovered after the work is already done |
| Equipment | Varies by project type and phase | Cost tracked by invoice, not by operating hour, so idle machines look identical to productive ones on paper |
| Materials | Varies by project type and phase | Costs allocated per unit but rarely tied back to the phase or crew that consumed them |
Why Equipment Cost Per Hour Deserves Its Own Line
An idle excavator and a working one cost the same on an invoice but tell completely different stories about a project. Equipment utilization, the share of time a machine is actively working rather than sitting idle, is one of the clearest indicators of whether budgeted equipment cost is translating into completed work. Fleets that track utilization alongside cost per hour catch underused machines early, instead of discovering at project close that a rented compactor barely ran for half the days it was billed.
What an Executive Dashboard Should Actually Show
A dashboard built for a project director does not need every field data point. It needs the handful of numbers that reveal whether a project is on track before the monthly report confirms it either way.
Four Metrics Worth a Permanent Spot on the Dashboard
Cost Per Operating Hour
The true burn rate for each machine, updated as it runs, rather than reconstructed from an invoice weeks later.
Budget Variance by Phase
Actual versus planned spend for the phase currently in progress, not just the project as a whole, so a director can catch drift before the whole budget absorbs it.
Equipment Utilization Rate
Active working time against total time on-site, exposing machines that are billed and present but not actually contributing to progress.
Cross-Project Comparison
The same cost categories reported the same way across every active project, so a portfolio review takes minutes instead of a week of reconciling spreadsheets.
FleetRabbit connects equipment, fuel, and maintenance data into one dashboard that shows cost per project, per phase, and per operating hour, so you can act on drift while it is still correctable.
Frequently Asked Questions
The Bottom Line for Project Directors
Budgets tell you what a project was supposed to cost. Visibility tells you what it is actually costing, while there is still time to do something about it. The directors who close that gap are not working with more data than everyone else. They are working with the same data, arriving sooner, organized around the numbers that actually predict where a project is headed.
FleetRabbit gives project directors a live view of cost by project, phase, and operating hour, built directly from equipment and field data. See where every dollar is going while it can still change the outcome.







