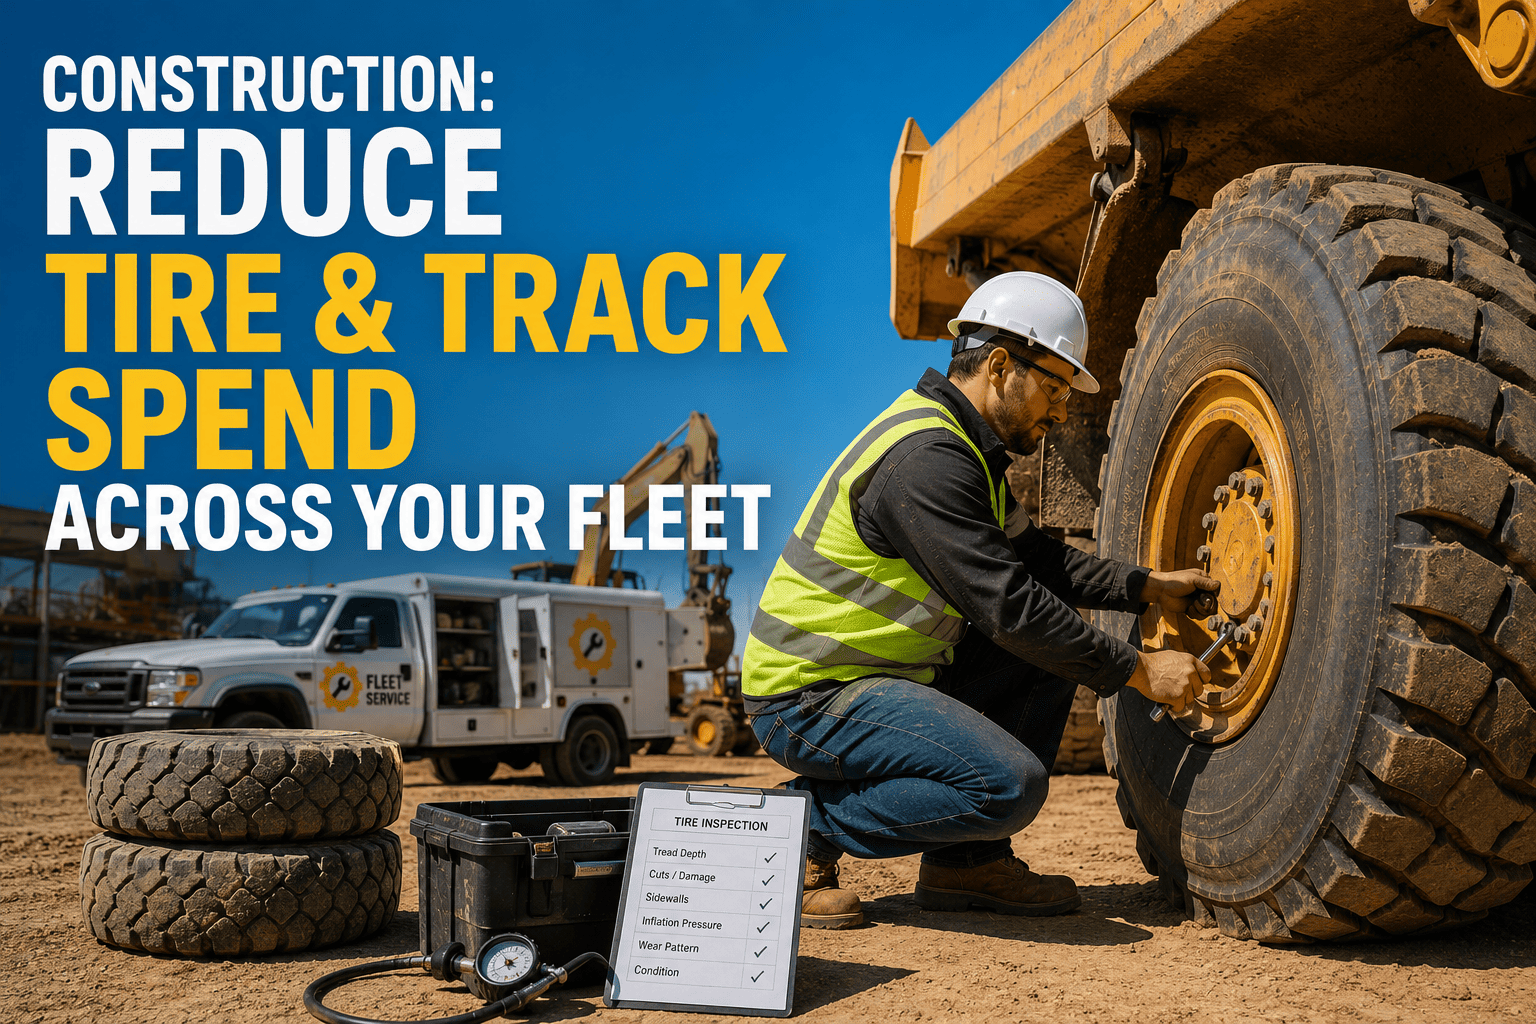
Ask most fleet managers what breaks the budget on a dozer or an excavator and they will point to the engine. The real answer is usually rolling around underneath it. Tracks, tires, rollers, sprockets, and idlers quietly consume more of a machine's lifetime cost than almost anything else on it, and because the wear happens gradually, it rarely gets the attention a blown engine would get. By the time someone notices, the fleet is often paying for a full undercarriage rebuild that could have been avoided.
Undercarriage components can account for up to 20 percent of a machine's purchase price but as much as 45 to 60 percent of its total lifetime repair and maintenance cost, making tires and tracks the single highest-value place to cut construction fleet spend. Most of that cost comes from controllable factors, track tension, operator habits, and terrain awareness, not the machine itself. FleetRabbit tracks wear trends, tension checks, and utilization hours across every asset so fleets catch problems while they are still a small adjustment, not a five-figure rebuild.
The Real Math Behind Tire And Track Spend
The undercarriage on a tracked machine is roughly 20 percent of its purchase price, yet it can account for up to half of everything spent keeping that machine running over its life. Tires on wheeled equipment tell a similar story on a smaller scale, wearing unevenly and failing early whenever load limits, inflation pressure, or terrain go unmanaged. The pattern across both is the same: a component that seems routine to replace is actually one of the largest levers a fleet has for controlling total cost of ownership.
Why Tension And Terrain Drive Most Of The Cost
Over-tight tracks increase friction between rollers, sprockets, and the chain itself, and can raise wear rates by as much as 50 percent. Loose tracks cause side-to-side snaking that breaks pins and links and increases the risk of derailing entirely. Add abrasive terrain like sand, gravel, or demolition debris, and wear rates can climb another two to three times faster than on stable ground.
Why A Few Hundred Hours Can Change The Whole Budget
Extending tire or undercarriage life by even 500 hours measurably lowers a machine's hourly ownership and operating cost, sometimes by close to a full dollar per hour once averaged across the fleet. Multiply that across dozens of machines running thousands of hours a year, and the tire and track line item becomes one of the most controllable costs a fleet manager has.
FleetRabbit logs tension checks, wear trends, and utilization hours for every tire and track in the fleet, so a small adjustment never turns into a surprise rebuild. You can sign up for free to see it on your own equipment, or book a demo to walk through the fleet-wide view.
What Drives Tire And Track Spend, And What Actually Fixes It
Most of the cost drivers behind tire and track spend trace back to a small handful of habits and conditions, each with a fairly direct fix once a fleet is watching for it.
| Cost Driver | Typical Impact | What Reduces It |
|---|---|---|
| Incorrect Track Tension | Up to 50 percent faster wear on rollers, sprockets, and chains | Scheduled tension checks against manufacturer sag specifications |
| Abrasive Terrain | 2 to 3 times faster wear on sand, gravel, or demolition debris | Terrain-aware shoe or tire selection and adjusted travel patterns |
| Excessive Reversing And Spinning | Doubles chain wear and increases fuel use during heavy use | Operator training on forward-motion technique and turn balance |
| Packed Debris In The Undercarriage | Can cut machine power and raise wear by roughly 30 percent | Daily end-of-shift cleaning before debris hardens or freezes |
| Delayed Component Replacement | A small adjustment ignored can cascade into a rebuild costing tens of thousands | Wear-percentage tracking that flags replacement at the right threshold |
Building A Fleet-Wide Program To Cut Tire And Track Spend
Reducing tire and track spend across a whole fleet is less about any single fix and more about consistency, the same checks performed the same way on every machine, every shift.
Step 1: Track Wear Trends Per Machine, Not Just Per Incident
A single measurement tells you where a machine stands today. A trend line tells you how fast it is heading toward the replacement threshold, which is what actually lets you plan a repair instead of reacting to one.
Step 2: Standardize Tension And Cleaning Checks Across Every Shift
Since tension is the single most controllable factor in undercarriage life, making that check a non-negotiable part of every shift closes the largest preventable cost gap most fleets have.
Why Per-Machine Baselines Matter
Two machines on the same job site can wear at very different rates depending on terrain and operator habits. Comparing every asset to the same flat interval misses that difference entirely.
Why Fleet-Wide Visibility Changes The Budget Conversation
Once wear data rolls up across the whole fleet, patterns emerge, one job site chewing through tracks twice as fast, one crew consistently running tighter tension than spec, and those patterns are where the real savings live.
Step 3: Replace At The Threshold, Not Before And Not After
Replacing a component too early wastes remaining service life. Replacing it too late risks damaging the surrounding parts it rides against, turning one repair into several.
Fleets that sign up for FleetRabbit typically start by pulling wear history on their highest-hour machines first, since that is usually where the biggest, most avoidable spend is already hiding.
Tires and tracks quietly account for nearly half of what you spend keeping equipment running. FleetRabbit gives you the wear visibility to catch small problems early, across every machine in the fleet.







