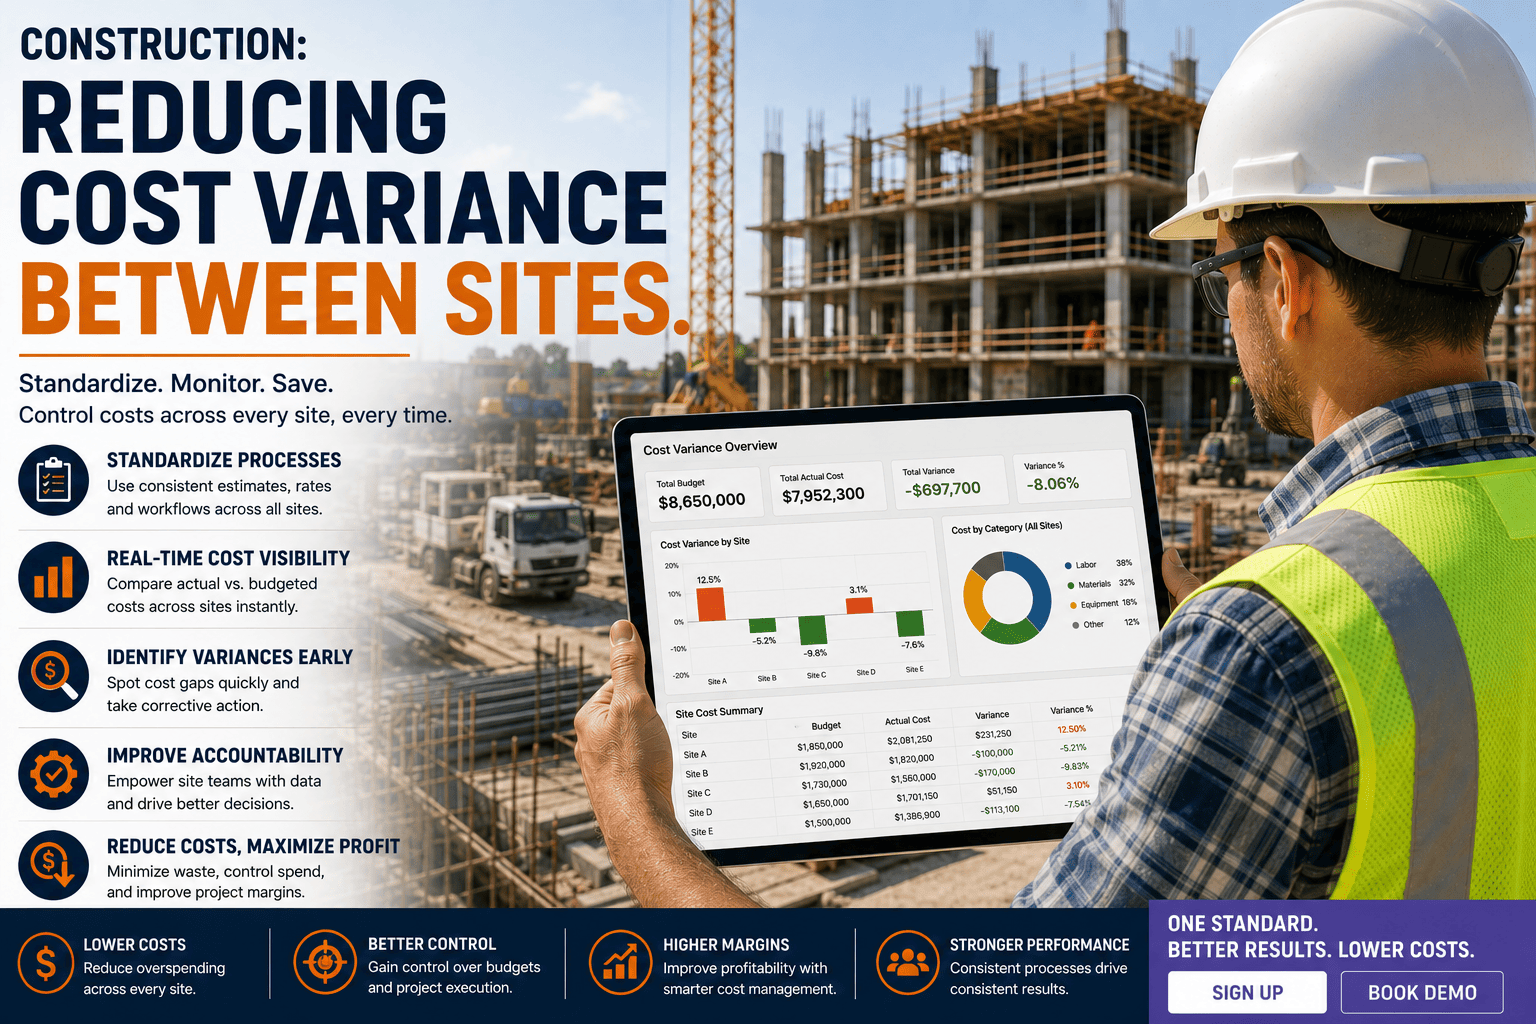
Same excavator, same model year, same crew size, two different job sites, and somehow one project's equipment costs come in 20 percent lower than the other. It happens on almost every multi-site contractor's books, and most of the time nobody can explain why until someone finally pulls the cost reports side by side. Cost variance between sites isn't random. It's a signal, usually pointing at a scheduling gap, a maintenance lag, or an allocation error that's been quietly skewing your project margins for months.
Any cost code variance above 10 percent between comparable projects deserves investigation. Equipment usage that isn't logged and split correctly between job sites is one of the most common hidden causes, quietly making one project look over budget and another look artificially profitable. Contractors who compare site-by-site equipment cost monthly catch these gaps before they compound across an entire fiscal year.
Why the Same Machine Costs Different Amounts on Different Sites
Equipment cost variance rarely comes from the machine itself. It comes from how that machine is used, tracked, and maintained differently depending on which job site it's assigned to. A backhoe running efficient eight-hour shifts on a well-organized site produces very different numbers than the same backhoe idling in traffic, running extra hours to cover a delay, or sitting through unplanned downtime on a site with looser oversight.
Same asset, same purchase price, same crew rate, a 28 percent cost-per-hour gap driven entirely by utilization and downtime differences. That gap, multiplied across a fleet and a fiscal year, is exactly the kind of money that disappears from margins without ever showing up as a single obvious mistake.
The Four Most Common Sources of Site-to-Site Variance
Utilization gaps top the list. A machine sitting idle for part of a shift still accrues ownership cost, so lower utilization directly raises effective cost per hour even though nothing "went wrong." Maintenance timing differences matter too, a site running deferred or rushed maintenance sees more unplanned downtime and higher emergency repair costs than a site following a consistent schedule. Allocation errors are a quieter culprit, when equipment hours split between two sites in the same week get logged as a single block, both projects' cost reports become inaccurate. And site conditions themselves, terrain, weather exposure, travel distance to the yard, genuinely change fuel burn and wear rate in ways that are real, not just administrative.
FleetRabbit tracks utilization, downtime, and cost per hour by machine and by site, so variance shows up in a report instead of a surprise at month end. Sign up free and see your own site comparison instantly.
Building a Site Comparison That Actually Tells You Something
A useful site comparison isn't just a total cost side by side, it breaks that total into the components that explain the difference, so you know exactly what to fix rather than just knowing something is wrong.
| Cost Component | Site A | Site B | What the Gap Usually Means |
|---|---|---|---|
| Effective Cost Per Hour | $58 | $74 | Lower utilization spreads fixed ownership cost across fewer productive hours |
| Unplanned Downtime | 4 hours monthly | 19 hours monthly | Maintenance schedule slipping or deferred at the higher-cost site |
| Fuel Cost Per Hour | $14 | $19 | Terrain, idle time, or longer haul distances driving extra consumption |
| Allocated Hours Accuracy | Logged daily | Logged weekly, estimated | Manual, delayed logging understates or overstates true site cost |
The 10 Percent Rule for Cost Codes
A widely used rule of thumb in job costing is simple, any cost code showing a variance above 10 percent between what was budgeted and what actually happened deserves a direct look before the phase closes. Applied to equipment specifically, that means comparing planned machine hours against actual logged hours by site every week rather than waiting for a monthly or end-of-project reconciliation, when the gap is far harder to trace back to its cause.
A Practical Process for Reducing Variance
Closing the gap between sites doesn't require ripping up your cost structure. It requires consistent, real-time data captured the same way across every job.
FleetRabbit automatically logs machine hours by site, standardizes cost-per-hour calculations across your fleet, and flags variance before it eats into project margin. Book a demo to see how it applies to your current projects.
Frequently Asked Questions
The Bottom Line
Cost variance between job sites is rarely a mystery once you're actually looking at the right data side by side. Utilization, downtime, and allocation accuracy explain almost every gap, and all three are visible the moment equipment hours get logged consistently and compared on a regular schedule. Contractors who build that habit stop discovering budget problems at project close and start catching them while there's still time to act.
FleetRabbit tracks utilization, downtime, and cost per hour across every machine and every site, so variance gets caught early instead of discovered at project close. Get started free, no credit card required.







