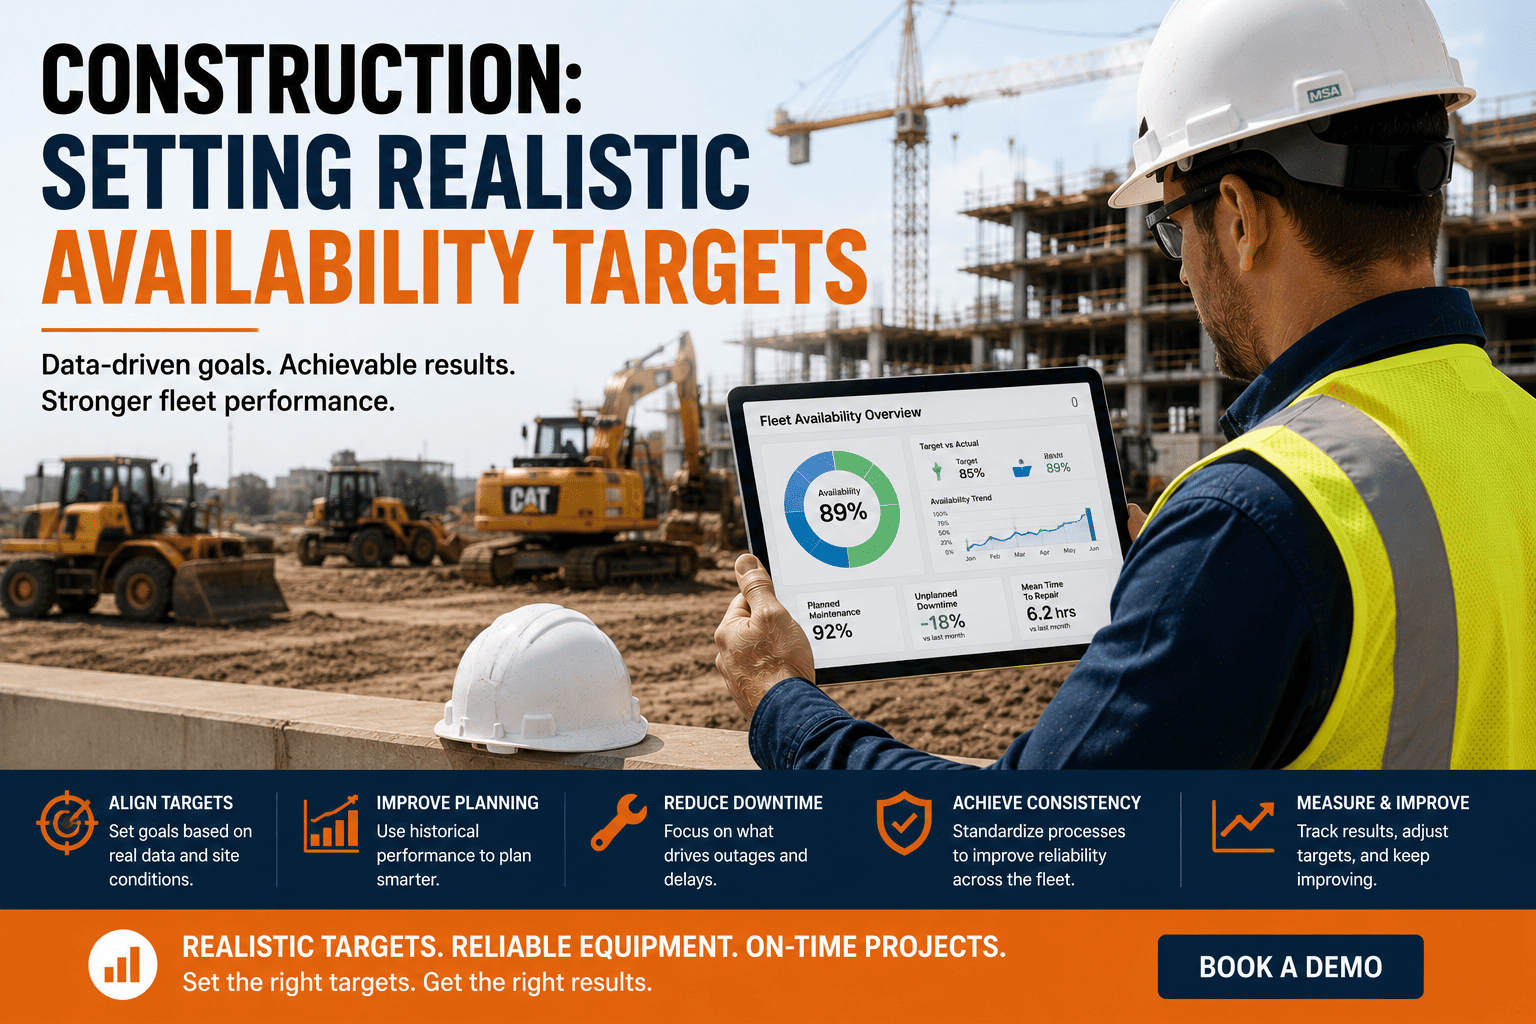
Someone in a planning meeting says "our fleet should hit 95 percent uptime" and everyone nods along, but nobody asks the obvious question: 95 percent of what fleet, doing what work, at what age? A ten-year-old excavator running double shifts on a mining project and a two-year-old skid steer sitting mostly idle in a yard should never be measured against the same number. Setting one flat target for an entire fleet almost guarantees that number will be wrong for most of the machines wearing it.
A realistic availability target depends on equipment class, asset age, and utilization level, not a single fleet-wide number. World-class availability sits above 92 percent, while the typical construction fleet averages 72 to 78 percent. Older assets, heavily utilized machines, and specialized equipment all carry different realistic ceilings. FleetRabbit benchmarks each machine against its own class and age so targets reflect reality instead of a guess.
Why One Flat Uptime Number Fails Every Fleet
Availability is shaped by forces that vary machine to machine. A brand-new haul truck and a fifteen-year-old dozer face fundamentally different failure rates, so holding both to the same target either sets the older machine up to fail or leaves real performance on the table for the newer one.
Equipment Class Sets a Different Ceiling
Earthmoving equipment, generators, and lifts each carry their own healthy performance range, and benchmarking every class against the same number hides real problems inside categories that are quietly underperforming.
Utilization Level Changes What "Available" Even Means
A machine running near 90 percent utilization faces elevated breakdown risk simply from the wear that heavy use creates, while a machine sitting at 40 percent utilization can post a high availability number that hides the fact it is barely being used at all.
| Equipment Category | Typical Fleet Average | World-Class Target |
|---|---|---|
| Excavators & Loaders | 72 to 78 percent availability | 92 percent or higher |
| Haul Trucks | Mean time between failures 400 to 600 hours | 1000+ hours between failures |
| Cranes & Specialized Lifts | Lower ceiling due to complexity and duty cycle | Benchmarked separately by manufacturer spec |
| Support & Yard Equipment | Wide variance, often under-monitored | Set relative to actual utilization, not a flat number |
FleetRabbit compares each asset against its own equipment class and age tier, not a single fleet-wide average. Sign up for free and see where your fleet actually sits against real benchmarks.
Age Changes the Math More Than Most Fleets Admit
A target that works for a machine in its first five years quietly becomes unrealistic once that same machine passes ten years of service. Setting age-adjusted targets keeps the goal honest instead of setting older assets up for constant disappointment.
| Asset Age | Realistic Availability Range | What Usually Drives the Gap |
|---|---|---|
| 0 to 5 Years | 90 to 96 percent | Warranty coverage, fewer wear-related failures |
| 5 to 10 Years | 82 to 90 percent | Rising component wear, longer parts lead times |
| 10+ Years | 70 to 82 percent | Accumulated wear, harder-to-source parts, rising repair frequency |
Why Chasing the Wrong Target Backfires
Holding a fifteen-year-old dozer to a 95 percent target does not motivate better maintenance, it just guarantees the number looks like failure every single month, even when the crew is doing everything right for a machine of that age.
Setting a Target That Actually Holds Up
Building a realistic target is a short exercise once the right data is in front of you, and it holds up far better under scrutiny than a number pulled from a generic industry article.
Step One: Segment Your Fleet Before Setting Any Number
Group by Class, Then by Age
Split the fleet into equipment categories first, then further by age tier within each category. A single average across the whole fleet buries the very differences that make one target unfair to half your machines.
Step Two: Anchor Targets to Your Own Failure History
Let Twelve Months of Data Set the Baseline
Pull mean time between failures and availability history for each segment over the past year. That documented baseline, not an industry average, is what makes a target defensible to leadership and achievable for the crew.
Step Three: Review and Tighten the Target Over Time
Treat the Number as a Living Target
As preventive maintenance improves and predictive alerts catch more issues early, gradually tighten each segment's target rather than resetting it once and leaving it untouched for years.
Bring your fleet roster to a live session and walk away with realistic availability targets segmented by class and age. Book your demo to build a benchmark your whole team can trust.
Frequently Asked Questions
The right availability target is not a single number borrowed from an industry blog, it is a set of realistic goals built around what each machine in your fleet can actually deliver. Sign up for free to see your fleet benchmarked by class and age, or book a demo to build targets your whole team can stand behind.
Stop measuring every machine against the same flat number. FleetRabbit benchmarks availability by equipment class, asset age, and utilization, so your targets reflect reality and your team knows exactly what good looks like.







