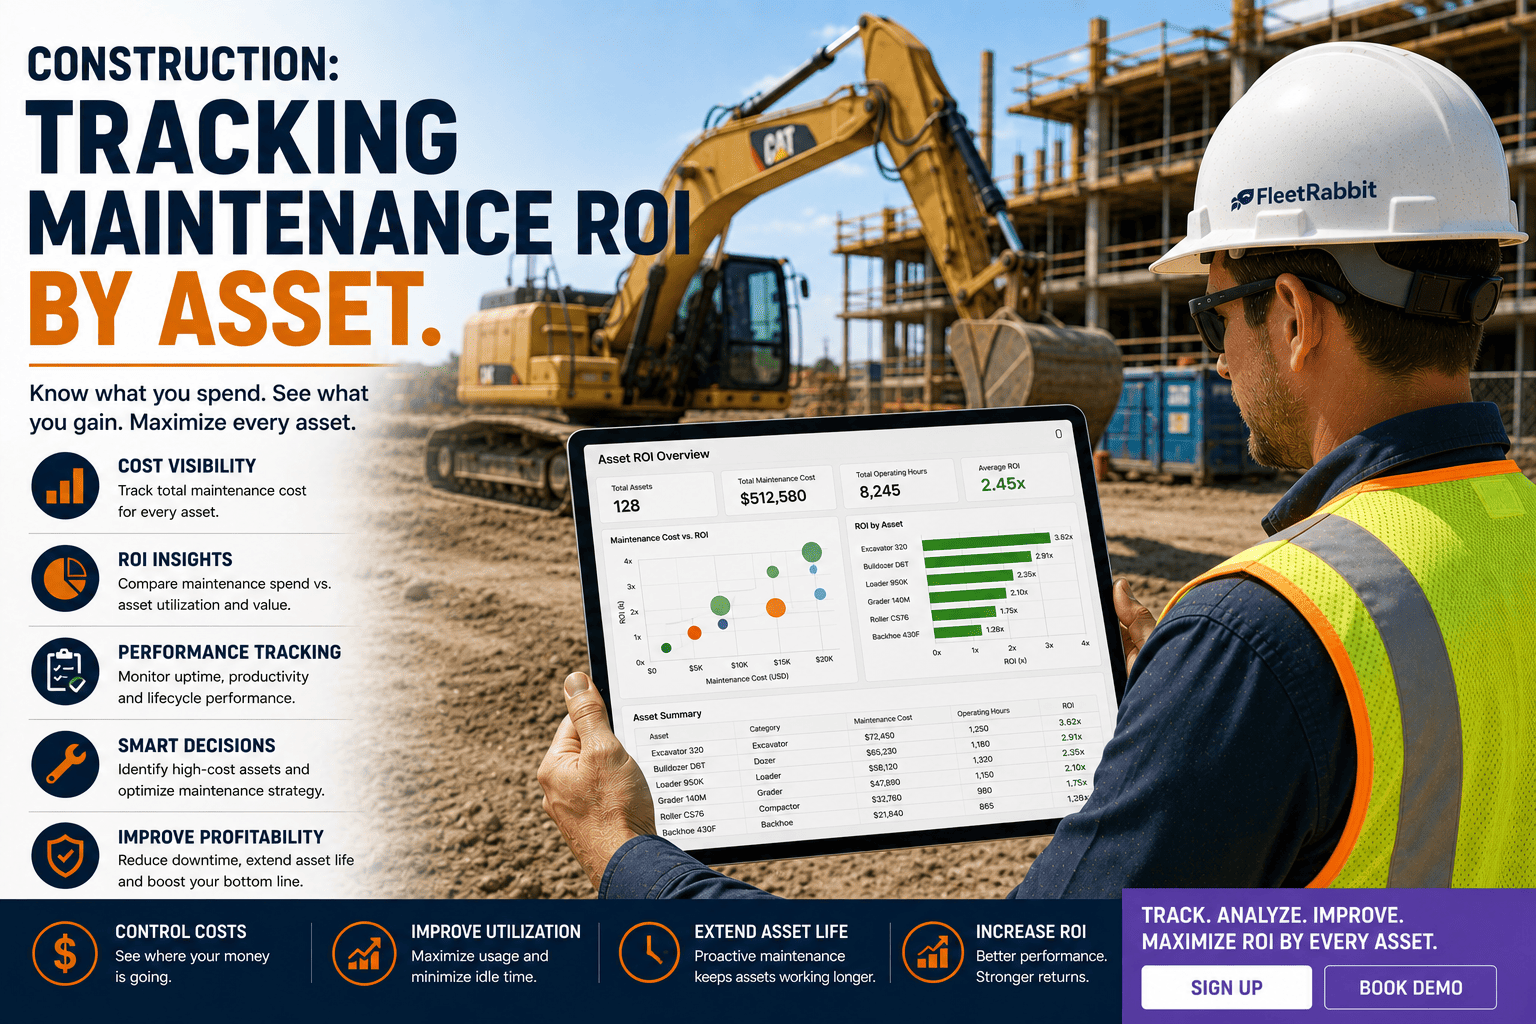
Ask most construction fleet managers what their maintenance program actually returns and you'll get a shrug, not a number. Maintenance gets treated as a cost center, a line item that only grows, because nobody is tracking it the way finance tracks everything else: dollars in, dollars saved, per asset. That's a problem, because a well-run preventive maintenance program is one of the highest-return investments a fleet can make, and without asset-level tracking, you can't prove it, defend the budget, or find out which machines are quietly draining money.
A well-executed preventive maintenance program typically returns 3 to 10 dollars for every 1 dollar invested. The math only works if you track cost and savings by individual asset, not as a fleet-wide average, because a handful of high-cost machines usually account for most of the return. Fleets that track ROI per asset consistently redirect budget toward the equipment that needs it most, instead of spreading maintenance spend evenly and guessing.
The ROI Formula Every Fleet Manager Should Know
Maintenance ROI isn't complicated math, it's simple math that most shops never actually run. The core formula compares what you spent on preventive maintenance against what you avoided in emergency repairs, downtime, and lost productivity.
Run this per asset, not just fleet-wide. A single excavator with a history of hydraulic failures can generate more ROI insight than twenty machines averaged together.
Why Fleet-Wide Averages Hide the Real Story
A blended, fleet-wide ROI number tells you maintenance is generally working, but it hides which machines are earning that return and which are quietly costing more than they save. Two machines with identical PM spend can produce completely different outcomes, one prevents three breakdowns a year, the other prevents almost none because its failure patterns don't match a calendar-based schedule. Only asset-level tracking reveals that difference.
FleetRabbit tracks preventive maintenance cost, avoided downtime, and repair history for every machine, then calculates ROI per asset so you always know where your maintenance dollars are working hardest. Sign up free and see it running against your own fleet.
What to Track on Every Single Asset
ROI by asset only works if the underlying data is actually captured at the machine level. Four numbers make up almost the entire picture.
A Simple Worked Example
Take a mid-size wheel loader with 6,000 annual operating hours. Over a year, its preventive maintenance program costs 8,000 dollars in labor and parts. That same program prevents two emergency hydraulic failures that would have cost roughly 4,200 dollars each in repairs, plus two days of lost jobsite productivity valued at 1,800 dollars per day. Avoided cost totals 11,400 dollars in repairs and 3,600 dollars in downtime value, 15,000 dollars against an 8,000 dollar program cost. That's an ROI of roughly 88 percent on this one asset alone, and it's a number you can actually defend in a budget meeting.
| Line Item | Amount | Notes |
|---|---|---|
| Annual PM Program Cost | 8,000 dollars | Labor, parts, and scheduled downtime for this single machine |
| Avoided Repair Cost | 11,400 dollars | Two prevented hydraulic failures at emergency repair rates |
| Avoided Downtime Value | 3,600 dollars | Two days of lost jobsite productivity, valued per day |
| Net Return | 7,000 dollars | Total avoided cost minus program cost |
| Asset-Level ROI | Approximately 88 percent | Net return divided by program cost |
Multiplying This Across the Fleet
Run this same calculation across every machine and patterns emerge fast. A handful of assets, usually the oldest or the ones running the harshest duty cycles, will show the highest ROI because they're the ones failing most often without maintenance. Other machines may show a low or even negative ROI, a signal that their maintenance schedule is over-servicing a low-risk asset. That's exactly the insight fleet-wide averages can never show you.
FleetRabbit's per-asset dashboards show avoided repair costs, downtime prevented, and ROI trends over time, giving you a defensible case for every maintenance dollar spent. Book a demo to see your fleet's ROI breakdown by machine.
Benchmarks Worth Tracking Against
Frequently Asked Questions
The Bottom Line
Maintenance stops looking like a cost center the moment you can point to a specific number and say exactly what it returned. Tracking ROI by asset, not by fleet average, is what makes that possible. It tells you which machines are earning their keep, which ones need a different maintenance strategy, and which dollars are working hardest across your entire operation.
FleetRabbit automatically tracks preventive maintenance cost, avoided repairs, and downtime savings for every asset in your fleet, so you always know exactly what your maintenance program is worth. Get started free, no credit card required.







