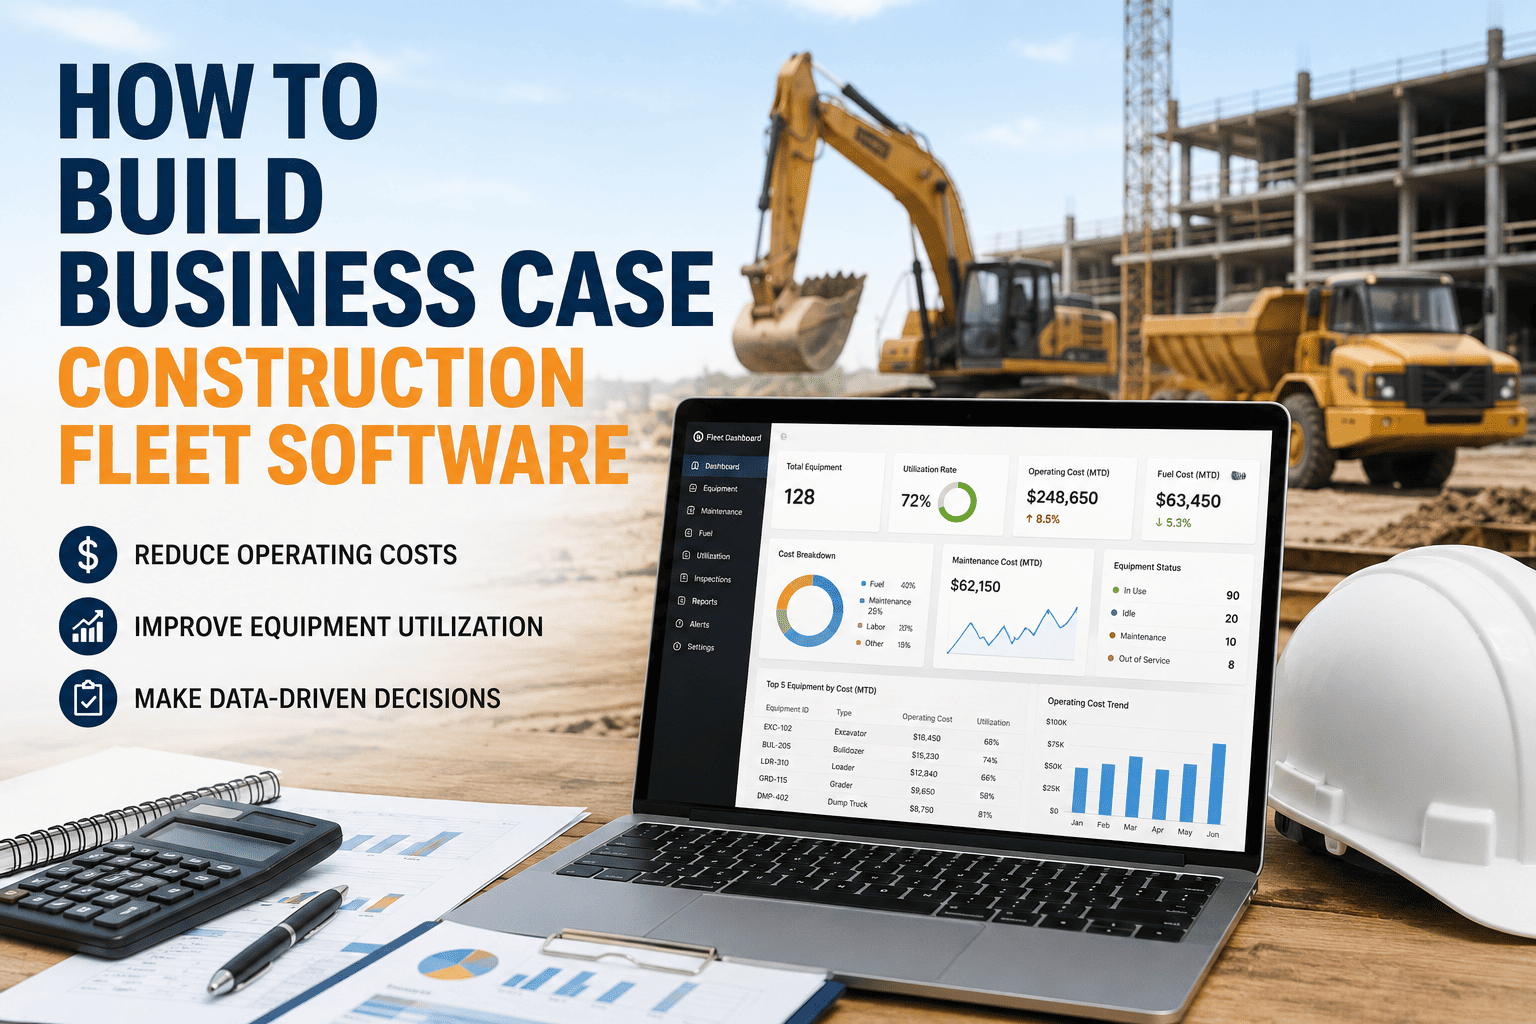
Every construction fleet manager eventually reaches the same meeting: standing in front of a finance director, asking for budget on software, armed with nothing but a gut feeling that things would run better with better tools. Gut feelings do not survive a budget review. Numbers do. Building a business case that finance actually approves means turning "this would help" into a specific, defensible dollar figure.
A strong business case for construction fleet software starts with your own twelve months of fuel, maintenance, and downtime data rather than generic industry averages. Construction companies deploying fleet software typically report 31 percent lower equipment downtime, 18 percent lower fuel costs, and 23 percent better equipment utilization within the first year, with most platforms paying for themselves within 60 to 90 days. Framing the software cost as a small percentage of total fleet spend that reduces the rest by 10 to 25 percent is the version of the case that clears a finance committee.
Why Gut Feeling Never Survives a Budget Meeting
Most fleet managers know their software need is real long before they can prove it. Machines break down at inconvenient moments, fuel spend feels higher than it should, and paperwork eats hours that could go toward actual project work. The problem is not that these observations are wrong. It is that "things feel inefficient" cannot compete with a line item that has a defined monthly cost and a start date.
A business case that survives scrutiny follows a consistent structure: establish your current cost of doing nothing, apply conservative and well-sourced savings assumptions, and present a payback timeline framed in weeks rather than years. Each step depends on the one before it, which is exactly why skipping ahead to a big ROI number without the baseline underneath it tends to collapse under the first follow-up question.
Start With the Cost of Doing Nothing
Before any software conversation begins, quantify what the current approach already costs. Pull twelve months of actual spend across fuel, maintenance, labor, insurance, and any downtime-related losses. This baseline becomes the number every projected saving gets measured against, and unlike a vendor's marketing claim, nobody in the room can dispute data pulled from your own invoices.
| Savings Category | Typical Range Reported | Where It Comes From |
|---|---|---|
| Equipment Downtime | 31% lower within the first year | Predictive maintenance catching failures before they strand a machine mid-project |
| Fuel Costs | 18% to 25% reduction | Idle tracking, route efficiency, and fuel card reconciliation eliminating waste |
| Equipment Utilization | 23% improvement | Real-time visibility into which machines sit idle versus which are overbooked |
| Administrative Time | 30% to 50% reduction | Automated reporting replacing manual spreadsheets and paper PM logs |
FleetRabbit's team can build an itemized savings model using your actual downtime, fuel, and maintenance history instead of generic assumptions. Sign up free to start pulling your own baseline numbers today, or book a demo and we will help you build the case with your team.
Framing the Cost So It Approves Itself
Numbers alone do not win a budget meeting. How they are framed decides whether a finance director sees an expense or an obvious decision. The strongest version of this argument treats software cost as a small percentage of total fleet operating spend, typically well under two percent, that directly reduces the remaining ninety-eight percent by ten to twenty-five percent.
Lead With the Payback Period, Not the ROI Percentage
A return on investment figure north of 300 percent sounds impressive but reads as abstract to someone deciding whether to approve a purchase order. A payback period of 60 to 90 days is concrete, easy to verify, and answers the only question that actually matters in a budget conversation.
Why Ranges Beat Single Numbers
A single best-case figure invites the first hard question: how was this calculated. A stated range with clear assumptions behind it holds up far better under scrutiny, because it shows the case was built conservatively rather than optimistically.
Separate Hard Savings From Soft Benefits
Fuel, maintenance, and downtime savings translate directly into dollars. Compliance readiness, driver and operator retention, and audit preparation matter just as much to leadership but resist clean monetization. Presenting these as a distinct section rather than folding them into the financial model keeps both parts of the case credible.
What Belongs in Each Category
Hard savings include fuel spend, maintenance cost per machine, and downtime-related revenue loss. Soft benefits include faster audit response, better operator retention, and reduced administrative stress on the team managing the fleet day to day.
FleetRabbit's analytics dashboard tracks downtime, fuel spend, and maintenance cost automatically, generating a monthly report you can hand directly to a finance director. Start your free trial today, or book a demo to see a sample business case built from real fleet data.
What the Finished Business Case Should Look Like
A complete case walks a decision-maker through four things in order: what the current approach costs today, what a conservative version of the software's benefit looks like against that baseline, how quickly the investment pays for itself, and which additional benefits matter but were left out of the hard number on purpose. Presented in that order, the case reads as evidence rather than a sales pitch, which is exactly the distinction that gets budget approved on the first pass instead of sent back for more detail.
Frequently Asked Questions
A business case built on your own fleet data is far harder to dismiss than a generic pitch. FleetRabbit helps you gather the baseline, apply conservative savings, and present a payback timeline that finance can actually approve.







