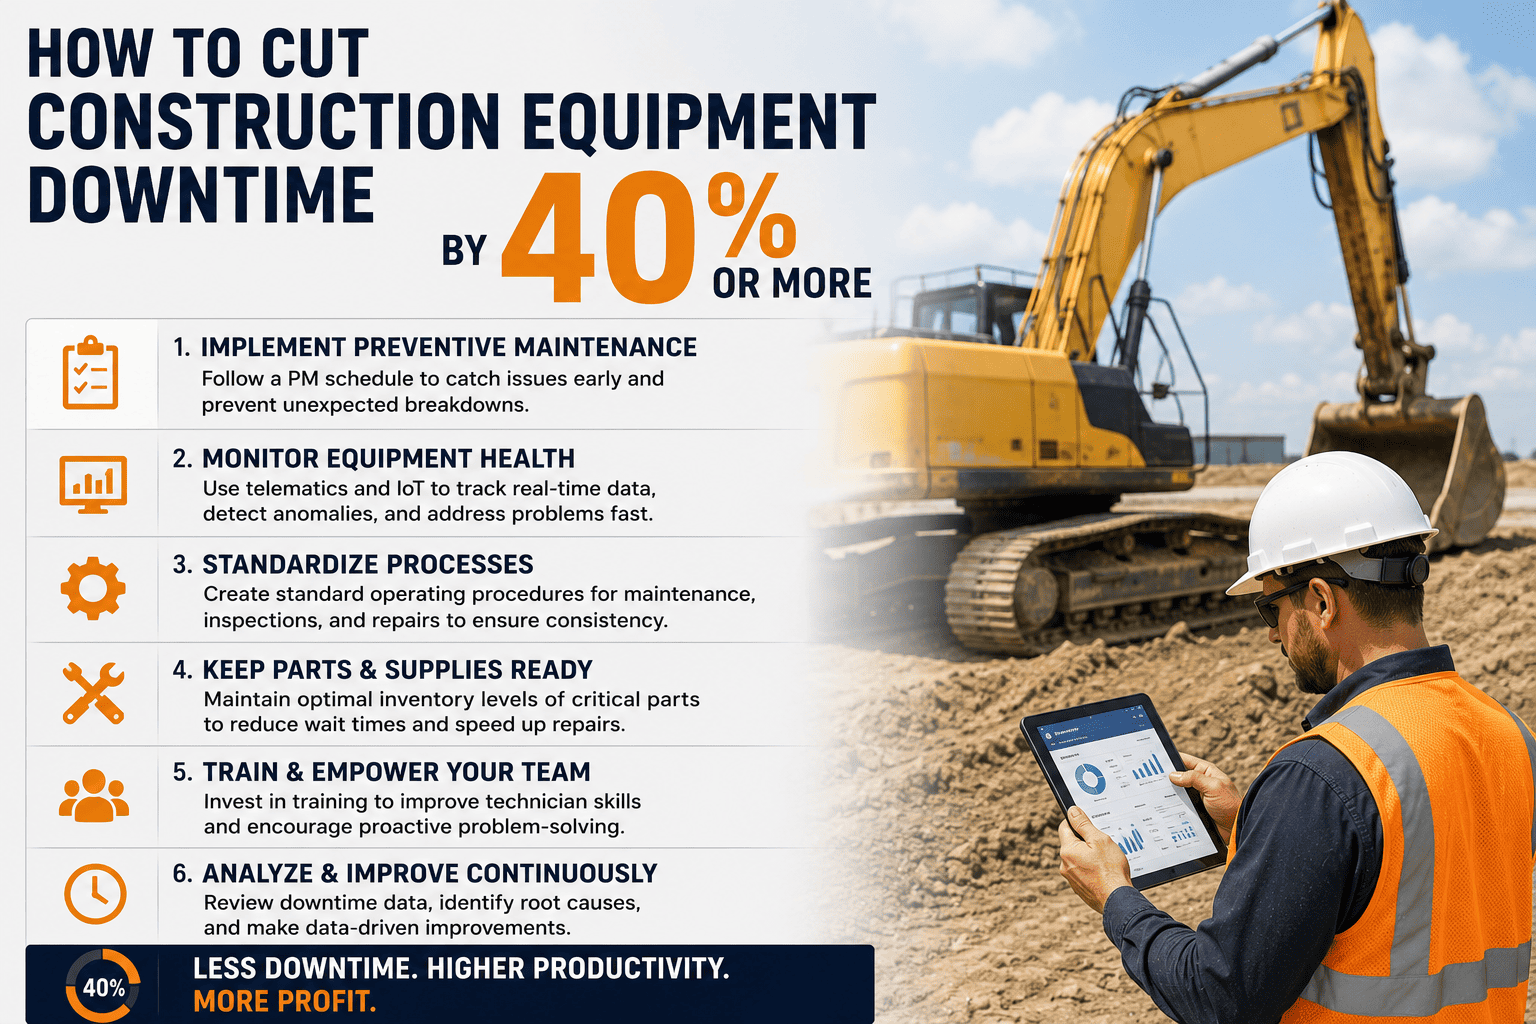
A single excavator sitting idle on a job site is never just one machine down. It is a crew standing around waiting, a concrete pour pushed back a day, a subcontractor rescheduling their own crew, and a milestone slipping past a contractual deadline. Most contractors track the repair bill and stop there, missing 60 to 70 percent of what the breakdown actually costs. The good news is that construction equipment downtime is one of the most preventable expenses in the industry, and contractors who build a structured uptime program are cutting unplanned downtime by close to 40 percent in a single season.
Construction fleets typically run 20 to 30 percent unplanned downtime per machine, costing 2000 to 10000 dollars a day in idle crew wages, rental replacements, and delay penalties. Daily inspections combined with predictive maintenance and real-time equipment health tracking cut that downtime by roughly 35 to 40 percent within one construction season, and every dollar spent on emergency repair avoided returns 3 to 5 dollars in prevented indirect costs.
Why Equipment Downtime Hits Construction Harder Than Other Industries
Unlike a factory floor where a spare machine can often cover for a broken one, construction equipment works on tight, interconnected schedules. When an excavator goes down, the trench isn't ready, so the plumbing crew can't start, so the concrete truck booking has to move, so the framing crew loses their start date. One breakdown routinely creates a ripple effect across two to four connected tasks, multiplying the real cost of the original failure several times over. Reactive repairs performed under pressure also cost far more than the same repair done on a planned schedule, because parts get rushed in at premium pricing and technicians work overtime to get the machine back on site.
The Three Layers of Downtime Cost
Understanding downtime cost means separating it into three layers that stack on top of each other.
FleetRabbit tracks every machine's health in real time and flags developing failures days before they strand a crew on site. Sign up free and see your fleet's downtime risk on day one, or book a demo to walk through your numbers with our team.
What's Actually Driving Downtime On Your Jobsite
Downtime rarely comes from one dramatic failure. It builds from a handful of repeatable, mostly preventable causes that show up on almost every construction fleet.
Hydraulic and Wear-Part Failures
Hydraulic systems are the leading cause of excavator and loader breakdowns, and the majority of those failures show visible warning signs, like weeping hoses or dropping pressure, weeks before the machine actually strands a crew.
Reactive, Calendar-Based Maintenance
Servicing equipment on a fixed calendar instead of actual engine hours means some machines get serviced too early while others run well past the point they needed attention, which is one of the biggest gaps between planned and unplanned maintenance ratios.
Poor Fleet Visibility Across Sites
Large amounts of construction equipment sit idle at any given moment simply because dispatchers don't know where a machine is or what condition it's in, so a working unit sits unused on one site while another site pays for an emergency rental.
Undocumented Pre-Shift Checks
A paper walk-around checklist that gets rubber-stamped catches nothing. Digital, mandatory inspections with photo evidence turn the five-minute pre-shift check into the cheapest downtime-prevention tool available.
| Downtime Cause | Typical Warning Window | Prevention Action |
|---|---|---|
| Hydraulic Failure | 2 to 6 weeks before failure | Pressure trend monitoring and hose inspection during pre-shift checks |
| Engine or Cooling Issue | 1 to 3 weeks before failure | Temperature and fault code alerts from real-time telematics |
| Undercarriage Wear | Several weeks, gradual | Scheduled inspection intervals tied to actual engine hours |
| Tire or Track Damage | Days to a few weeks | Daily visual check and pressure or tension monitoring |
| Electrical Fault | Intermittent, hard to predict | Fault code history review during scheduled service windows |
The Playbook: How Fleets Cut Downtime by 40 Percent
Contractors who move the needle on downtime aren't relying on luck or on buying newer machines. They're following a repeatable sequence that starts small and compounds fast.
Step One: Establish Your Baseline
Pull the last 12 months of repair records and tag every incident as planned or unplanned, along with the downtime hours and the crew that was affected. Most contractors find their real downtime cost is 40 to 60 percent higher than what they'd estimated, because the idle-crew and rental costs were never being tracked alongside the repair invoice.
Step Two: Put a Digital Pre-Shift Check On Every Machine
Replace the paper clipboard with a mobile checklist that requires a photo on any flagged defect and automatically creates a tracked work order. This is the lowest-cost, highest-impact change most fleets can make, because it catches the two-to-six-week warning window that hydraulic and engine failures almost always give.
What a Good Pre-Shift Check Covers
Fluid levels, visible leaks, hose condition, undercarriage and track tension, and the safety systems, including ROPS, seatbelt, backup alarm, and fire extinguisher. Structured correctly, the whole walk-around takes about five minutes per machine.
Step Three: Move Maintenance to Engine Hours, Not the Calendar
Condition-based scheduling tied to actual usage catches developing wear before it becomes a breakdown and stops technicians from servicing machines that don't need it yet, freeing up labor hours for the units that do.
Step Four: Give Every Site Real-Time Visibility Into the Whole Fleet
When dispatchers can see every machine's location and health status across every site, a breakdown at one location can be covered by a genuinely idle unit somewhere else instead of an expensive same-day rental.
Why This Step Compounds the Other Three
Baseline data, pre-shift checks, and hour-based scheduling all feed into one system. The value isn't any single step, it's having all four working together so a developing failure is caught, scheduled, and resolved before it ever reaches a job site as an emergency.
FleetRabbit combines digital pre-shift inspections, hour-based maintenance scheduling, and live fleet visibility in one platform, so developing failures get caught weeks before they strand a crew. Start free and see it on your own fleet, or talk through your setup with our team.
Uptime Benchmarks Worth Tracking
You can't improve what you don't measure. These are the numbers worth putting on a monthly dashboard.
Planned Versus Unplanned Maintenance Ratio
Fleets running structured maintenance programs typically get to 75 to 85 percent planned versus unplanned, compared to fleets without any digital system, which often run closer to 50 percent unplanned. If your ratio is closer to the second number, that's your biggest opportunity.
Downtime Hours Per Machine Per Month
Track this per unit, not just fleet-wide, since a handful of chronic-problem machines often account for a disproportionate share of total downtime and are usually the best candidates for early replacement or component upgrades.
Cost Per Idle Hour
Multiply your average burdened crew rate by crew size to get a true idle-hour figure, then track it against repair cost so downtime decisions get made on the full number instead of just the invoice.
Frequently Asked Questions
Every unplanned breakdown costs far more than the repair bill once you count the idle crew, the rental, and the slipped milestone. FleetRabbit gives you the early warning to fix it on your schedule, not the machine's. Start free today or book a walkthrough with our team.







