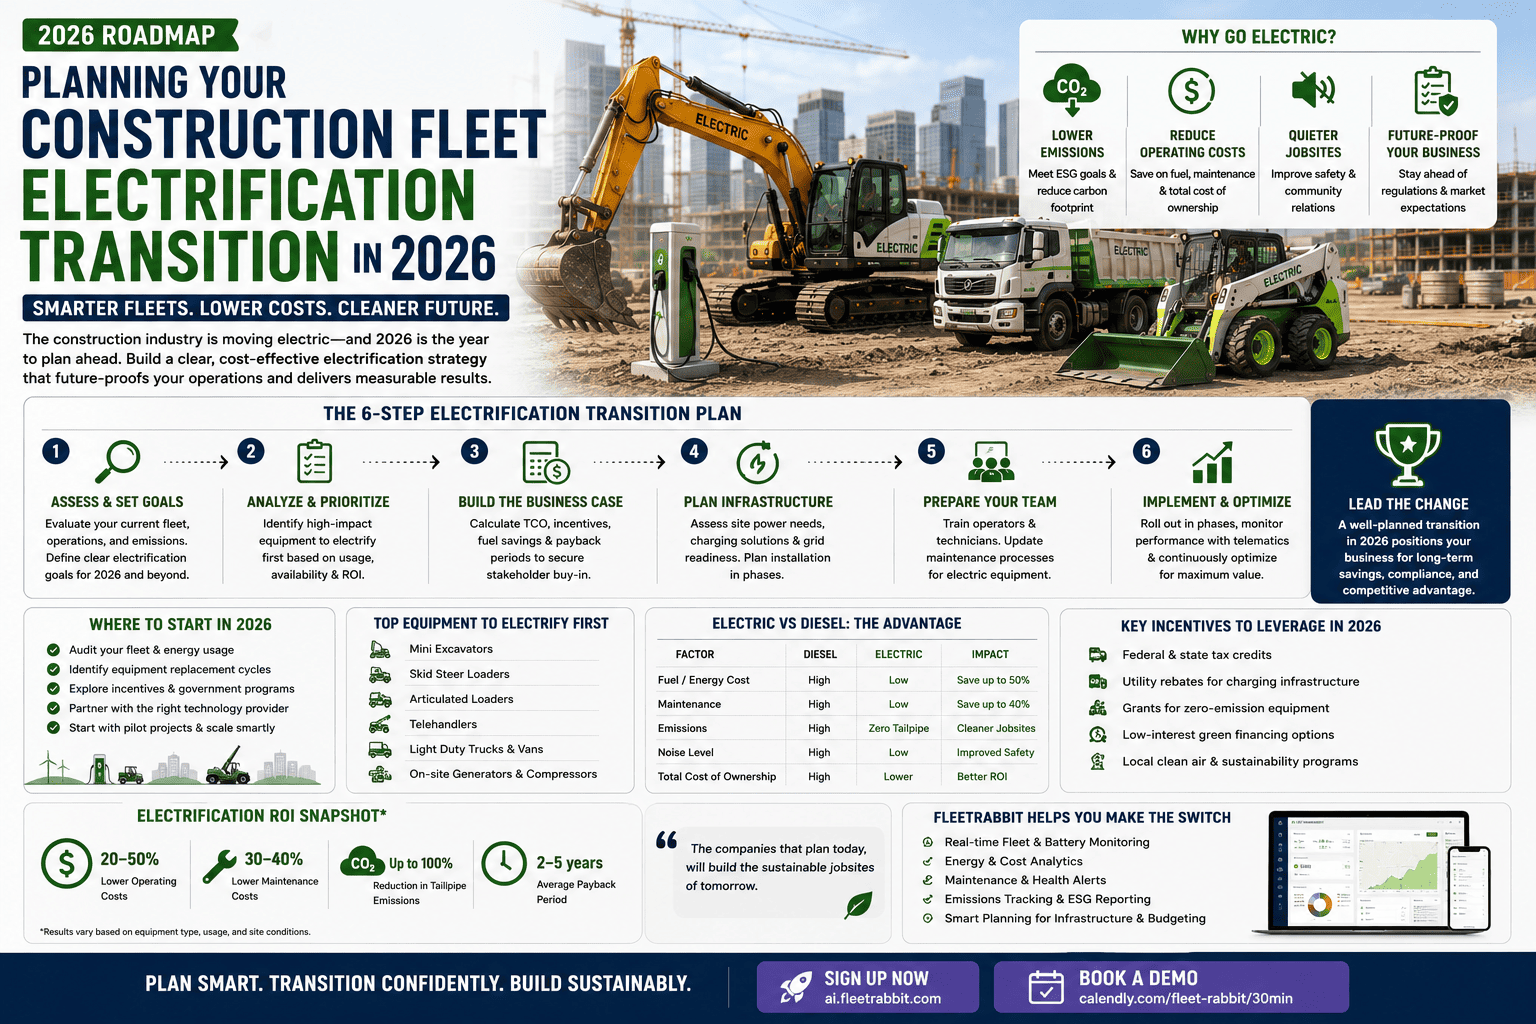
Most contractors who abandon their electrification plans didn't fail because the technology let them down. They failed because they treated electrification like a purchase order — buy a few electric machines, park them next to the diesel fleet, and hope the transition manages itself. It doesn't. A construction fleet electrification transition is a multi-year operational program with its own sequence, its own data requirements, and its own failure points, and skipping the planning stage is the single most common reason projects stall out after the first six months.
The contractors getting this right in 2026 aren't necessarily the ones with the biggest sustainability budgets. They're the ones who started with data instead of intent — pulling utilization records, duty-cycle patterns, and route data before deciding which three or four machines become the pilot group. That single decision, made well or made carelessly, tends to determine whether the entire program succeeds.
A construction fleet electrification transition typically spans three to seven years across three phases: a one-year pilot covering five to ten percent of the fleet, a two-to-three-year expansion phase, and full deployment. Twenty to forty percent of most fleets are strong electrification candidates today based on duty-cycle and utilization data. Payback typically lands in three to five years, and contractors following a disciplined phased approach see twenty-five to forty-five percent better total cost of ownership outcomes than those who rush deployment.
The Three-Phase Roadmap Contractors Actually Follow
Fleet electrification that works follows a predictable rhythm, even though every contractor's fleet looks different. Compressing this into a one-to-two-year sprint is the most common way programs fail — it leaves no room to catch charging bottlenecks, seasonal performance drops, or route mismatches before they become fleet-wide problems.
Pilot Phase — Year 1
Electrify five to ten percent of the fleet, chosen from machines with the most predictable duty cycles and the easiest access to overnight charging. The goal isn't productivity gains yet — it's surfacing the operational realities that spreadsheets can't predict: charging bottlenecks, route adjustments, and how battery performance shifts across seasons.
Expansion Phase — Years 2 to 3
Scale to twenty-five to forty percent of the fleet using the lessons the pilot exposed. Charging infrastructure gets built out further, technicians complete high-voltage training, and the utilization data collected during the pilot guides exactly which machine classes come online next.
Full Deployment — Years 4 to 7
Remaining eligible equipment transitions on a schedule tied to natural replacement cycles rather than forced early retirement. Machines with duty cycles that still exceed battery capability stay on diesel or move to hybrid options until the technology catches up.
Contractors who want a realistic timeline for their own fleet rather than a generic one usually find it faster to book a demo and walk through actual utilization data than to guess at phase boundaries from a blog post.
Which Machines Should Electrify First
Not every machine in a fleet is a good electrification candidate today, and treating them as equally ready is how budgets get wasted on the wrong pilot group. The fleets that get this decision right start by analyzing duty cycles, not by picking the newest or most visible equipment.
Reading Utilization Data Before You Buy Anything
The strongest candidates share three traits: predictable daily duty cycles, return-to-yard patterns that allow overnight charging, and total daily runtime that fits comfortably within current battery ranges. Machines running unpredictable hours, operating far from any charging point, or running continuous eight-plus-hour duty cycles on remote sites are typically better left on diesel for now. Roughly twenty to forty percent of most construction fleets meet the strong-candidate criteria today, with another thirty to fifty percent becoming viable within three to five years as battery capacity improves.
The Data Points That Actually Matter
Daily hours of operation, distance from charging infrastructure, load intensity, and how often a machine sits idle between shifts all feed into the candidacy decision. A compact loader running predictable eight-hour shifts on an urban site with overnight yard access is a far stronger pilot candidate than a wheel loader running unpredictable double shifts across a remote job site with no power access.
| Infrastructure Item | Typical Cost | Planning Notes |
|---|---|---|
| Level 2 Charging Port | $3,500 to $7,500 per port | Standard for overnight depot charging of compact and mid-sized equipment |
| DC Fast Charging | $50,000 to $350,000+ | Reserve for larger equipment or sites needing rapid mid-shift top-ups |
| Electrical Service Upgrade | $10,000 to $40,000 | Often the longest lead-time item — start permitting during the pilot phase |
| Site Preparation | $5,000 to $25,000 | Trenching, conduit, and mounting costs vary widely by existing site conditions |
FleetRabbit analyzes duty cycles, runtime patterns, and yard proximity across your fleet to flag exactly which machines are ready for electrification now — and which ones need another three to five years of battery development.
Why Total Cost of Ownership Math Gets Underestimated
Purchase price is the number every budget conversation starts with, and it's also the number that misleads the most. Upfront acquisition cost typically represents only forty to sixty percent of an electric machine's total lifecycle expense. The rest lives in charging infrastructure, electrical upgrades, technician training, maintenance savings, and energy costs — and fleets that skip a full TCO model almost always end up with a budget that runs short mid-program.
Where the Real Savings Show Up
Maintenance savings across a machine's lifetime typically run six to twelve thousand dollars, driven by the absence of oil changes, filter replacements, and exhaust system service. Energy costs run well below diesel fuel costs on a per-hour basis. Combined, these operating savings are what turn a higher purchase price into a three-to-five-year payback rather than a permanent cost increase.
The Mistake That Breaks the Budget
The most expensive planning mistake is calculating TCO using only fuel and maintenance savings while ignoring infrastructure. Electrical service upgrades in particular carry long permitting lead times and can add tens of thousands of dollars that never appear in a simple purchase-price comparison. Building infrastructure costs into the model from day one, rather than discovering them mid-pilot, is what separates the twenty-five to forty-five percent better outcomes phased fleets report from the programs that blow through their first-year budget.
Common Reasons Electrification Programs Stall
Programs rarely fail because the equipment underperforms. They fail because the surrounding plan wasn't built to support it. Charging infrastructure gets installed too late, so pilot machines sit idle waiting for power. Pilot groups get chosen based on visibility or novelty rather than duty-cycle fit, so the pilot reports poor results that don't reflect what a well-matched machine would actually deliver. And utilization data that could guide phase two either isn't collected during the pilot or never makes it into a system anyone actually reviews before the expansion budget gets approved.
Avoiding these failure points isn't complicated, but it does require tracking the right data from day one. Fleets that sign up before the pilot begins, rather than after problems surface, generally have a full year of utilization history to base their expansion-phase decisions on.
FleetRabbit tracks utilization, duty cycles, and charging access across your entire fleet to show exactly which machines are ready to electrify now, and which ones should wait. Start the pilot phase with a plan built on your own operating data.







