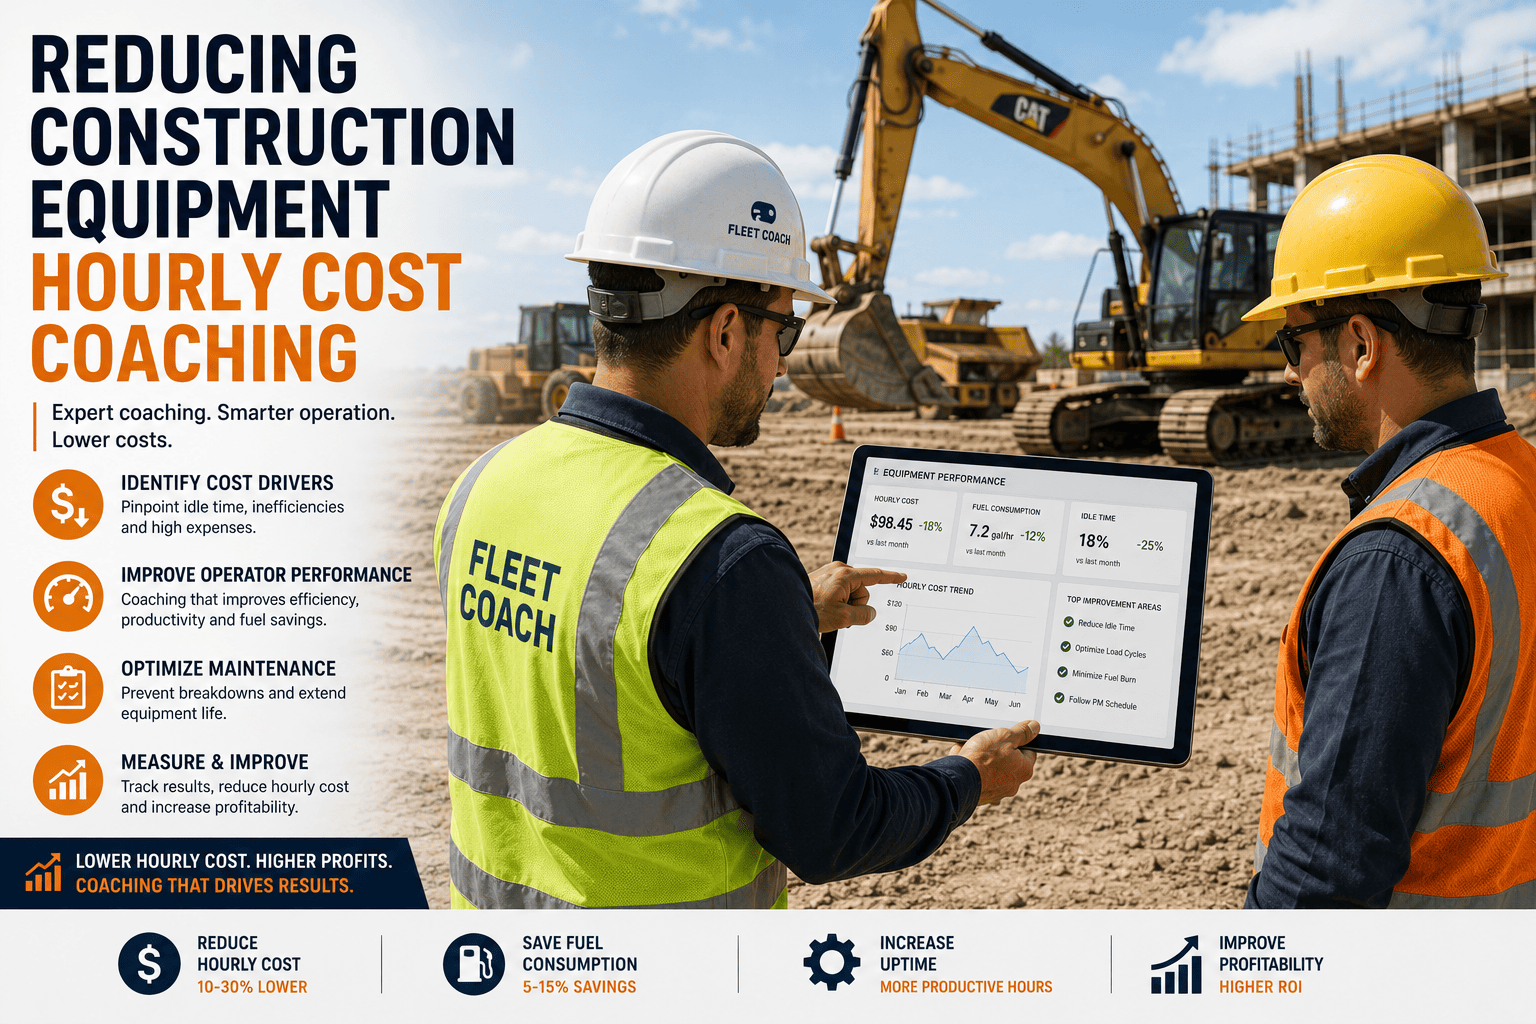
Every excavator, loader, and dozer on your job site has a number attached to it that most crews never see: its true hourly operating cost. That number moves every single day, and the biggest lever pulling it up or down is not the machine. It is the person sitting in the seat. Two identical machines on the same job, run by two different operators, can post hourly costs that differ by 15 to 25 percent, purely because of throttle habits, idle time, and how hard the controls get worked.
Most contractors track fuel bills and repair invoices, but very few connect those numbers back to individual operating behavior. Coaching changes that. When operators get clear, specific feedback on how they run a machine, hourly costs drop fast, often within the first few weeks, without a single dollar spent on new equipment.
Operator coaching backed by telematics and harsh-event data can lower hourly operating cost by 10 to 20 percent through reduced idling, smoother throttle use, and fewer harsh events. On a machine costing 50 dollars an hour to run, that is 5 to 10 dollars saved every operating hour, or 10000 to 20000 dollars annually on a machine logging 2000 hours a year.
Why Hourly Operating Cost Is the Number That Matters
Hourly operating cost combines fuel, scheduled maintenance, wear parts, repairs, and the wages tied to running the machine, then divides that total by productive hours. It is the figure that should drive every bid, every rental decision, and every fleet replacement plan, yet it is frequently miscalculated because it treats every hour of runtime as equal. An hour spent idling at high RPM, an hour of aggressive digging, and an hour of smooth, load-matched operation all cost dramatically different amounts, even though they show up as the same single hour on an hour meter.
Fuel alone makes up roughly 30 to 40 percent of equipment operating expenses, and a typical excavator can burn 6 to 10 gallons of diesel an hour, so even small shifts in how that fuel gets used move the hourly number meaningfully. Fleet studies on operator-driven fuel savings have found that a 10 percent efficiency improvement from operator technique can translate into 5000 to 10000 dollars saved per machine each year, and that scales directly with fleet size. Coaching is what turns that potential into a repeatable result instead of a one-time fluke.
The Three Habits That Drive Cost Up
Idle Time That Never Gets Questioned
A machine sitting at idle still burns 0.5 to 1 gallon of fuel per hour while producing nothing. Reducing idle by just one hour daily on a machine running 2000 hours a year saves 125 to 250 gallons of fuel annually, and that is before counting the extra engine hours it puts on components that did not need to run.
Harsh Throttle and RPM Spikes
Fuel burn rises with the cube of engine revolution, so operators who work at unnecessarily high RPM for the task at hand consume disproportionately more diesel and DEF for the same amount of work completed, quietly inflating the fuel line of the hourly cost.
Aggressive Digging, Swinging, and Braking
Hard bucket impacts, abrupt swing stops, and rough travel accelerate wear on hydraulics, undercarriage, and structural components. Repeated harsh events shorten component life and pull scheduled repairs forward, raising the maintenance share of hourly cost.
FleetRabbit pulls idle time, harsh events, and fuel burn straight from your telematics feed and ranks operators by hourly cost impact, so coaching conversations are backed by data instead of guesswork. Sign up free and see your first operator scorecard this week.
What Coaching Actually Looks Like
Coaching is not a one-time training session filed away and forgotten. It is a short, recurring loop of measuring, reviewing, and adjusting that fits into a normal work week without slowing down production.
Capture Machine Data Automatically
Telematics on each machine logs idle time, RPM patterns, harsh event counts, and fuel burn continuously, with no manual entry required from operators or foremen.
Turn Raw Data Into a Simple Scorecard
Numbers get converted into a plain, comparable score per operator per machine per week, so a supervisor can see who is running efficiently at a glance rather than digging through raw logs.
Hold a Short, Specific Conversation
A five-minute weekly check-in focused on one or two specific behaviors, such as idle time or harsh swings, works better than a long annual review covering everything at once.
Track the Trend, Not Just the Snapshot
Coaching sticks when operators can see their own score improving week over week, turning cost control into a habit rather than a one-time correction.
How Coaching Changes the Cost Breakdown
The table below shows where hourly operating cost typically sits before a coaching program starts, and the realistic range fleets see after operators receive consistent, data-backed feedback over three to six months.
| Cost Component | Before Coaching | After Coaching | Primary Driver of Change |
|---|---|---|---|
| Fuel and DEF | 30 to 40 percent of hourly cost | 6 to 12 percent reduction in fuel line | Lower idle time, load-matched RPM, smoother throttle work |
| Scheduled Maintenance | Standard manufacturer intervals | Fewer early interval triggers | Reduced harsh events lowering wear on hydraulics and undercarriage |
| Unscheduled Repairs | Frequent, tied to abuse patterns | Noticeably fewer incidents | Early flagging of rough operation before components fail |
| Engine and Component Life | Shortened by unnecessary run hours | Extended useful life | Less idle runtime and fewer high-stress cycles logged on the hour meter |
| Operator Productivity | Inconsistent across shifts | More consistent output per hour | Better throttle and load management improving cycle efficiency |
Reading the Data: What Good Looks Like
Coaching only works when everyone agrees on what a good number looks like. Without a benchmark, a scorecard is just noise. These reference ranges give supervisors a starting point for judging operator performance fairly, adjusted for machine type and application.
Idle Time Benchmark
Well-run fleets typically keep idle time under 20 to 25 percent of total engine hours. Operators consistently above 35 to 40 percent idle are strong candidates for a coaching conversation focused specifically on shutdown habits during waits and breaks.
Harsh Event Rate Benchmark
Tracking harsh events per operating hour rather than as a raw count lets you compare a busy operator fairly against a lightly scheduled one. A rising trend in harsh events per hour over consecutive weeks is a more reliable coaching trigger than any single bad day.
Fuel Burn Per Productive Hour
Because fuel consumed rises with the cube of engine revolution, comparing fuel burn per productive hour rather than per total hour highlights operators who are working the engine harder than the task requires, even if their total output looks similar to peers.
FleetRabbit builds idle time, harsh event, and fuel benchmarks from your own fleet history, so every coaching conversation is measured against your machines and your job sites, not generic industry averages. Book a demo to see how the benchmarks are built.
Building a Coaching Program That Sticks
Programs that last share a few common traits. They keep feedback frequent and small rather than saving everything for an annual review. They show operators their own trend line so improvement feels earned rather than imposed. And they tie coaching to something operators care about, whether that is machine assignment, incentive pay, or simple recognition among the crew.
Companies that invest in operator training see repair costs drop by 25 to 40 percent, which is a direct reflection of how much of the maintenance and repair line in hourly cost is actually shaped by day-to-day operating habits rather than the machine itself. Pairing that training with ongoing telematics-based coaching keeps those gains from fading once the initial training session is a distant memory.
Getting Started in Four Weeks
Week one is about establishing a fair baseline: pull 30 to 60 days of existing telematics history per operator and machine before making any judgments. Week two introduces the scorecard to operators, framed as a shared tool for improving pay and machine assignment rather than a disciplinary measure. Weeks three and four run the first short coaching cycles, focused on the single highest-cost behavior for each operator rather than trying to fix everything simultaneously.
The Bottom Line
Hourly operating cost feels like a fixed number that only changes when you buy newer equipment, but the biggest swing factor is sitting in the operator's seat every single shift. Coaching backed by real telematics data turns vague advice like drive smoother into specific, measurable feedback that operators can actually act on, and the savings show up in fuel bills and repair invoices within months, not years.
Fleets that start tracking idle time, harsh events, and fuel burn per operator today have a real shot at cutting hourly cost by double digits before the year is out. Fleets that keep treating every hour as equal will keep paying the hidden premium for it.
FleetRabbit turns raw telematics data into simple operator scorecards, so you can coach with confidence and watch your hourly operating cost drop within weeks. Sign up free to see your first scorecard, or book a demo to walk through the data with our team.







