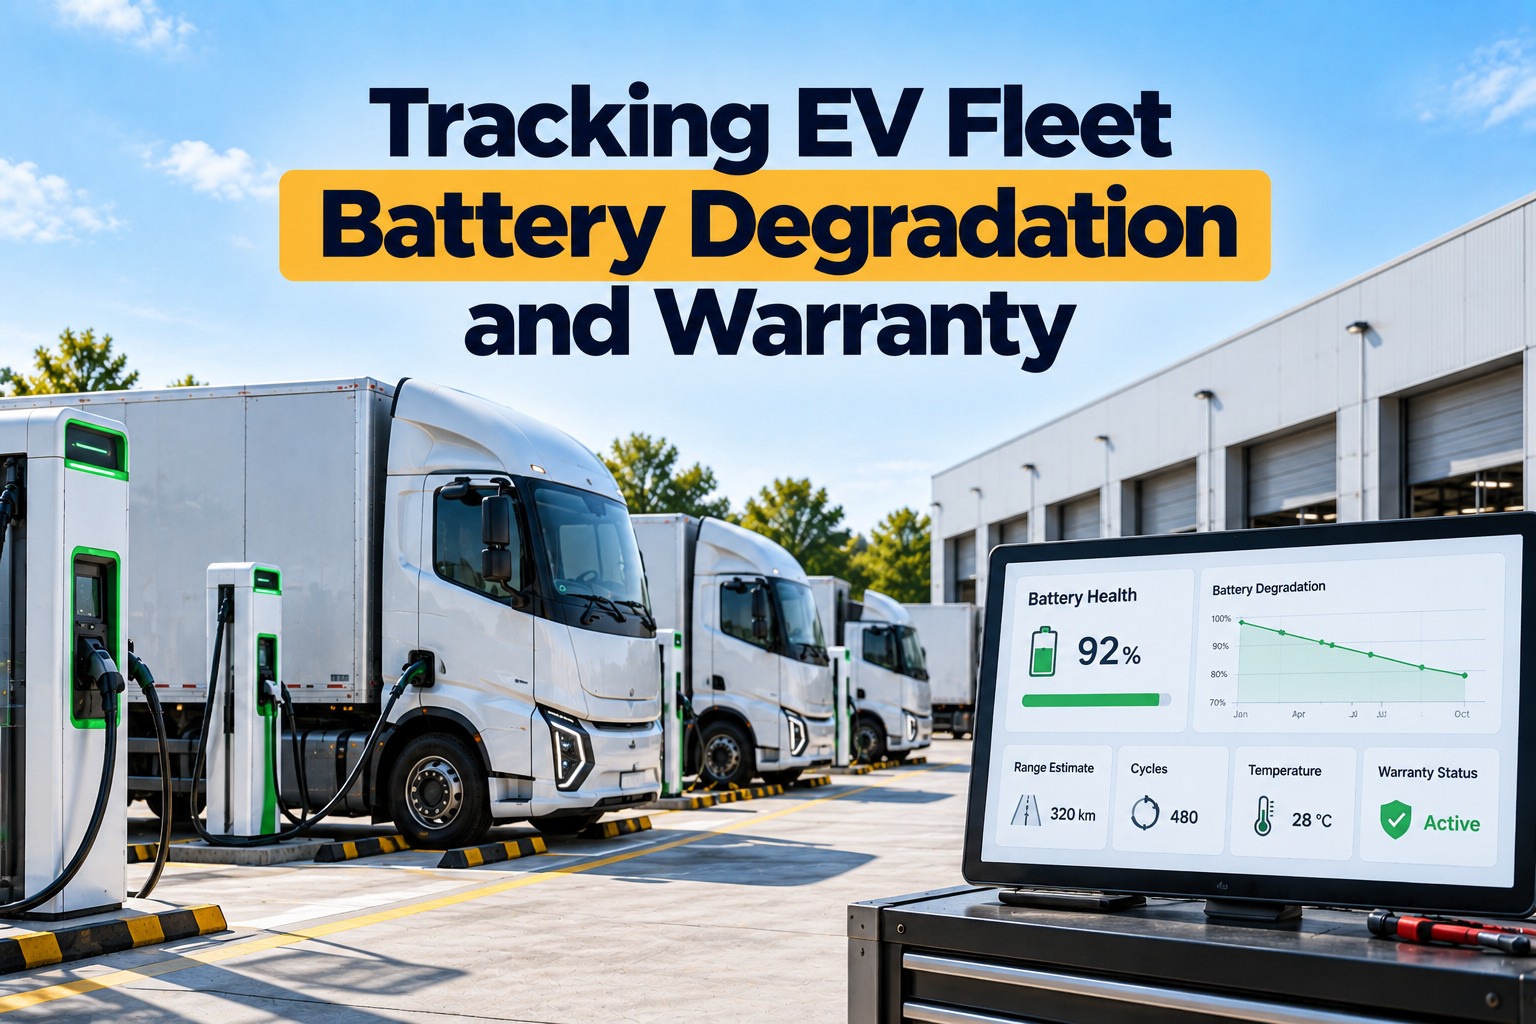
Three different numbers govern an electric vehicle's battery, and they do not agree with each other. California requires a warranty down to 70% state of health for "eight years or 100,000 miles, whichever first occurs." A separate durability rule asks for 80% at ten years or 150,000 miles, but only across half the test sample. And the number on the dashboard is permitted to read high rather than low. For a fleet none of this is academic, because the mileage leg of that warranty arrives years before the eight-year leg does — on a hard-worked van, often before year three, which means the window for making a degradation argument closes while the vehicle still looks new. Book a battery health review.
Your Eight-Year Battery Warranty Is a Two-Year Warranty
What the regulation actually promises, why a working vehicle burns through it on miles rather than years, what the dashboard figure is allowed to do, and the record a claim needs before the threshold is crossed rather than after.
Three Numbers, and Only One of Them Is Yours
They sound like the same thing and they are routinely quoted as if they were. They are three separate obligations measuring different things on different clocks.
State of health, for model years 2026 through 2030. 75% for 2031 and later. The period is “eight years or 100,000 miles, whichever first occurs,” and what is warranted is freedom from “defects in materials and workmanship which cause” the battery to fall below it.
A separate obligation on the manufacturer's fleet, not a promise about your vehicle: 70% at eight years or 100,000 miles, and 80% at ten years or 150,000 miles. Critically, only 50% of the test sample has to pass.
An onboard monitor showing “current level of deterioration in the battery relative to when it was new,” displayed “to the driver, in vehicle, without the use of a tool.” Its permitted error runs in one direction only.
The middle one deserves a second look. A durability standard that 50% of the sample must pass is a statement about a manufacturer's production, not an entitlement attached to the vehicle on your yard. Your specific unit can sit in the half that did not pass and nothing has been breached. The only number with your name on it is the warranty threshold.
The Mileage Leg Arrives First, and Not Narrowly
This is the part that changes how a fleet should think about battery warranty, and it is pure arithmetic rather than a forecast.
The regulation says "eight years or 100,000 miles, whichever first occurs." A private car doing 15,000 miles a year takes 6.7 years to reach the mileage limit, so the two legs are roughly balanced and the eight-year figure means something. A regional delivery van on 30,000 miles a year reaches it in 3.3 years. A hard-run unit on 50,000 reaches it in two. Nothing is being withheld — the term is exactly as written. It is simply that the headline number was never describing your use case.
| Annual mileage | Mileage leg expires | Warranty term never used | What it means in practice |
|---|---|---|---|
| 15,000 mi/yr | 6.7 years | 1.3 years | Private use. The year limit is the one that bites. |
| 25,000 mi/yr | 4.0 years | 4.0 years | Half the term unused. |
| 30,000 mi/yr | 3.3 years | 4.7 years | Regional delivery. Most of the term unused. |
| 40,000 mi/yr | 2.5 years | 5.5 years | The warranty is effectively two and a half years. |
| 50,000 mi/yr | 2.0 years | 6.0 years | Three quarters of the term forfeited. |
| 60,000 mi/yr | 1.7 years | 6.3 years | Under two years of cover on an eight-year warranty. |
The practical consequence is a deadline. Any degradation argument has to be made while the warranty is still live, which on a working vehicle means inside the first two to three years — not at year seven when someone finally thinks to check. A fleet that starts measuring in year four has usually missed the window on its hardest-worked units.
Find out which units are already past the point of claiming
Most fleets can say how old a vehicle is. Far fewer can say how many warranty miles it has left, or what its state of health was doing twelve months ago. In thirty minutes we will set up the countdown against your in-service odometers and show which units are the exposed ones.
What the Dashboard Figure Is Permitted to Do
There is now a regulated onboard state-of-health monitor, which is a real improvement. It is worth reading the specification closely rather than trusting the output.
The requirement is a monitor showing the "current level of deterioration in the battery relative to when it was new" on a 0 to 100-percent scale, displayed "to the driver, in vehicle, without the use of a tool," and also readable through a standardised service tool. So the number exists and you can get at it. Then comes the accuracy clause: the monitor value must be "no more than 5% higher" than the usable battery energy determined by testing.
Read that tolerance carefully, because it is one-sided. The rule caps how optimistic the display may be. A monitor reading five points above the tested reality is compliant. One reading five points below it is not constrained by that clause at all. Which means a dashboard showing 74% on a vehicle whose warranty threshold is 70% is not comfortably clear of the line — it may be sitting on it.
If a unit is approaching the threshold with warranty time left, the figure that matters is the one from a service tool with its method recorded, not the one on the dash. The dash figure is the right thing for spotting a trend and the wrong thing for making a claim.
Why the Onboard System Is Not the Measurement
Independent work on this landed in 2026 and it is uncomfortable reading for anyone relying on the vehicle to report its own condition.
A study of 1,114 electric vehicles in real-world service compared onboard battery management system health reporting against measured degradation. In the worst-degrading units, 93% were not flagged by the BMS at all. The correlation between what the system reported and what was actually happening ran at roughly 0.10 to 0.24 — weak enough that, for identifying your problem vehicles, the onboard figure performed close to not looking.
The same study found something that cuts against the received wisdom: ambient temperature and rapid-charging frequency showed no statistically significant correlation with degradation across the sample. That does not make either harmless, and it is one study. But it does mean a fleet cannot assume it knows which of its vehicles are degrading fastest by reasoning from duty cycle. The vehicles have to be measured, individually and repeatedly.
What Heavy Duty Has Instead
An honest caveat, because the figures above have a specific scope and it is narrower than "electric fleet".
The warranty threshold, the durability requirement and the monitor specification all sit in California's light-duty rules — the regulation covers battery electric and plug-in hybrid "passenger cars and light-duty trucks" from model year 2026. If your electric fleet is delivery vans and light trucks, every number on this page applies to you directly. If it is Class 7 and 8 battery electric trucks, there is no equivalent statutory state-of-health threshold, no mandated dashboard monitor and no fixed term.
What governs a heavy-duty battery is whatever the purchase contract says. Which makes three questions worth settling before signature rather than after: what state-of-health percentage triggers cover, over what years and miles and which comes first, and whose measurement decides. The last one is the one most often left vague, and it is the one that determines whether a disagreement has an answer.
What a Claim Needs on Record
Assembled while the vehicle is in service rather than reconstructed afterwards. Swipe the table sideways on mobile.
| What to hold | Why it decides the outcome | Cadence |
|---|---|---|
| The in-service date and the odometer at it | Both legs of the warranty run from it, and the mileage leg is the one that will expire. | Recorded once, at delivery |
| A state-of-health reading on a fixed cadence | One reading tells you nothing. A series tells you the rate, and the rate tells you whether you will cross the threshold inside the term. | Monthly, same conditions |
| The reading method and the tool | A dashboard figure and a service-tool figure are different measurements with different tolerances. A claim needs to say which one. | Logged with every reading |
| Charging history | How often the vehicle saw rapid charging, and at what state of charge it typically sat. The first question anyone assessing a claim will ask. | Continuous, from the charger |
| Duty cycle and load | What the vehicle was actually asked to do, so degradation can be attributed to use rather than to a defect, or the other way round. | Per route or per shift |
| Any manufacturer software update | Battery management behaviour changes with firmware, and so can the reported number. A step change in readings with no change in use usually has a date against it. | Each time one is applied |
What the regulation warrants is freedom from "defects in materials and workmanship which cause" the battery to fall below the threshold — so the question in any disputed claim is whether the degradation came from a defect or from how the vehicle was used. Only one side of that argument usually has records. It is worth being the side that does.
How FleetRabbit Handles This
Four things, and the first is the one most fleets have never set up.
FleetRabbit holds the in-service odometer and the current one, so the warranty shows as miles remaining rather than a date years away. On a hard-working vehicle those are very different facts.
Readings recorded on a cadence with the method and the tool against each one, so you hold a rate of change rather than a single number of unknown provenance.
Which units are approaching the threshold, which are approaching the mileage limit, and which are approaching both at once — the last group is where the money is.
In-service date, reading history, charging pattern, duty cycle and firmware dates on one record, so a claim is a report rather than an archaeology project.
Questions Fleets Ask
How long is an EV battery warranty really?
Eight years or 100,000 miles, whichever first occurs, down to 70% state of health for model years 2026 to 2030 and 75% from 2031. For a fleet the mileage leg is the live one: at 50,000 miles a year it expires in two years, leaving six years of term unused. Check your countdown.
Can I trust the state of health shown on the dashboard?
For spotting a trend, yes. For a claim, no. The monitor is permitted to read up to five percentage points higher than tested reality, and that tolerance runs in one direction only, so a vehicle displaying 74% against a 70% threshold is not necessarily clear of it. Use a service-tool reading with the method recorded. Log readings properly.
Does the battery management system warn us before a battery degrades?
Mostly not, on the available evidence. A 2026 study of 1,114 vehicles found 93% of the worst-degrading units were never flagged by their own BMS, with correlation between reported and measured health around 0.10 to 0.24. Measure independently and on a cadence. Set up a cadence.
What about our heavy-duty electric trucks?
None of the statutory thresholds apply — the regulation covers passenger cars and light-duty trucks. Heavy-duty battery cover is whatever the contract says, so settle the percentage, the term, which leg expires first and whose measurement decides before you sign. Record the terms per unit.
Does fast charging void or shorten the warranty?
Check the specific contract, because terms vary and some do set conditions on charging behaviour. Worth knowing that the 2026 study found no statistically significant correlation between rapid-charging frequency and degradation across its sample — which is not a licence, but it does mean the assumption cuts both ways. Record your charging history either way, because it will be asked for. Talk through your terms.
When should we start measuring?
At delivery. The in-service odometer is what both warranty legs run from, and a first reading taken at year four has no baseline behind it and no rate of change to show. On a high-mileage unit, year four is often after the window has already closed. Start at vehicle one.
Can we track this alongside our diesel vehicles?
Yes, and most fleets running electric units are running something else too. The body, brakes, tires and every inspection obligation are identical, so battery state of health and warranty countdowns belong as extra fields on the same maintenance record rather than in a separate spreadsheet nobody opens. Track degradation free.
Measure It While the Warranty Is Still Live
FleetRabbit holds the in-service odometer, the warranty countdown in miles, and a state-of-health series with the method against every reading — alongside diesel, CNG, propane and hybrid units on one schedule. So the claim is ready before the threshold is crossed, not after.
Free for 3 vehicles · no credit card required