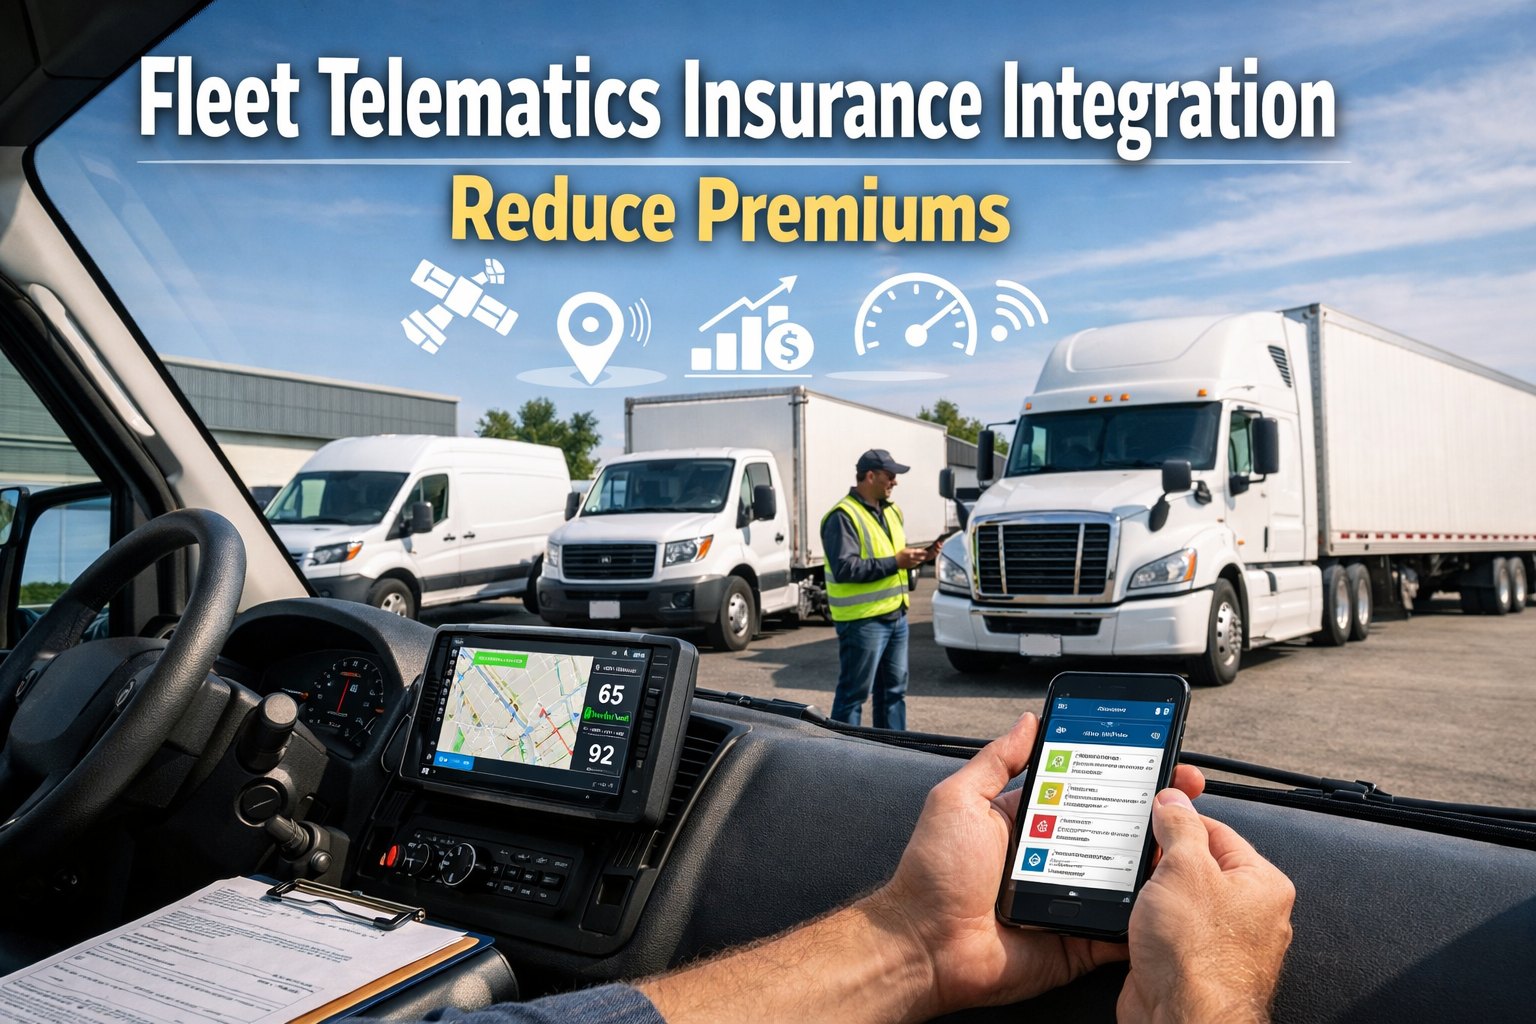
Commercial fleet insurance premiums have increased 47% since 2020, with the average cost per vehicle now exceeding $14,200 annually. Nuclear verdicts averaging $27.5 million, rising repair costs, and increased accident frequency are driving rates up across the entire industry but here's what most fleet managers don't realize: safe fleets are subsidizing dangerous ones. Without telematics data sharing, insurers treat your fleet like every other operation in your class, regardless of your actual safety record. The fleets that break this cycle are seeing 12-25% premium reductions by proving their safety performance with real data. FleetRabbit's fleet telematics insurance integration automatically shares driver safety scores, behavior metrics, and incident documentation with your insurer — converting your safety investments into measurable premium savings that compound every renewal cycle. Book a demo to calculate your potential savings, or start your free trial today.
Insurers are actively seeking fleets willing to share telematics data because it fundamentally changes their risk calculation. Traditional underwriting relies on industry loss ratios, vehicle classifications, and historical claims — factors that punish safe fleets for the sins of their industry peers. Telematics-based insurance (also called usage-based insurance or UBI) evaluates your actual fleet performance: how your drivers behave, how well you maintain vehicles, and how quickly you respond to incidents. Fleets with documented safety records, automated accident reporting, and verifiable driver behavior data represent quantifiably lower claims probability — and insurers reward that reduced risk with substantially lower premiums. This comprehensive guide reveals exactly how telematics insurance integration works, what data insurers evaluate, which carriers participate, and how to maximize your premium reduction potential before your next renewal.
Turn Your Safety Data Into Lower Insurance Premiums
Share telematics with insurers automatically. Reduce premiums 12-25%. Generate accident reports in seconds. Protect drivers from fraudulent claims.
The Commercial Fleet Insurance Crisis
Understanding why premiums have exploded helps explain why telematics data sharing has become so valuable to insurers — and so profitable for fleets willing to participate. The commercial auto insurance market has fundamentally changed since 2020, and fleets that adapt to this new reality are capturing significant competitive advantages while others struggle with unsustainable cost increases.
Nuclear Verdicts
$27.5M averageJury awards exceeding $10 million have increased 335% since 2010. A single catastrophic claim can wipe out years of premium payments from hundreds of policyholders, forcing insurers to raise rates across entire classes.
Repair Cost Inflation
+32% parts & laborAdvanced driver assistance systems, sensors, cameras, and specialized components have made even minor repairs dramatically more expensive than they were five years ago.
Accident Frequency Up
+18% industry-wideDistracted driving, driver shortages leading to less experienced operators, and increased delivery demand have all contributed to more accidents per mile driven across the industry.
- Pay industry average rates regardless of actual safety performance
- Safety program investments generate zero premium credit from insurers
- Subsidize dangerous fleets in your vehicle classification category
- No meaningful leverage during annual renewal negotiations
- Highly vulnerable to staged accidents and fraudulent injury claims
- Slow, manual incident reporting delays claim resolution by days
- 12-25% premium reduction based on your actual demonstrated data
- Every safety investment directly translates to measurable savings
- Usage-based pricing rewards your specific fleet's performance
- Data-backed leverage for stronger renewal negotiation position
- Video plus GPS proof defeats false claims and staged accidents
- Automated FNOL reports generated in minutes instead of days
What Data Insurers Evaluate for Premium Discounts
Understanding exactly what data insurers use to calculate usage-based premiums helps you optimize your fleet's performance in the areas that matter most. FleetRabbit captures and formats all of these metrics automatically, presenting them to insurers in exactly the format their underwriting systems require. Book a demo to see your current risk profile and identify improvement opportunities.
The single most important factor in telematics-based underwriting. Insurers correlate specific driving behaviors directly with accident probability and claim severity outcomes.
- Speed Compliance: Percentage of time within posted limits and company policies
- Hard Braking Events: Frequency and severity of sudden deceleration incidents
- Rapid Acceleration: Aggressive starts that indicate risky driving patterns
- Cornering Severity: G-force measurements during turns indicating control issues
- Following Distance: Headway time to vehicle ahead when available from sensors
- Distraction Indicators: Phone usage detection, lane departures, erratic speed patterns
When, where, and how much your fleet operates significantly affects risk exposure. Insurers analyze operational patterns to identify high-risk exposure periods and geographic concerns.
- Time-of-Day Distribution: Percentage of miles during high-risk nighttime hours (10pm-5am)
- Annual Mileage: Total exposure miles affecting overall risk calculation per vehicle
- Route Risk Profiles: Exposure to high-accident corridors and challenging road conditions
- Idle Time Ratios: Excessive idling often correlates with driver attention issues
- HOS Compliance: Hours of service violation rates indicating driver fatigue risk
- Geographic Distribution: Operating in high-litigation vs. low-litigation states
Well-maintained vehicles are demonstrably safer vehicles. Insurers increasingly factor maintenance compliance into risk calculations as predictive maintenance data becomes more available.
- PM Schedule Compliance: Percentage of preventive maintenance completed on time
- DVIR Completion Rates: Daily inspection compliance indicating overall safety culture
- Defect Resolution Time: How quickly identified safety issues get properly repaired
- Brake System Health: Condition monitoring data for critical safety systems
- Tire Condition Tracking: Tread depth monitoring and pressure compliance rates
- Recall Response Time: How quickly manufacturer safety recalls are addressed
Historical claims data remains important, but telematics allows insurers to see improvement trends over time — actively rewarding fleets that are demonstrably reducing their risk profile.
- Incident Frequency: Number of reportable incidents per million miles driven
- Claim Severity Trends: Average cost per claim and directional movement over time
- At-Fault Percentages: Ratio of at-fault vs. not-at-fault incidents in your history
- Recovery Rates: Success in subrogation recovery from at-fault third parties
- Near-Miss Data: Hard braking events that indicate avoided potential accidents
- Improvement Trajectory: Month-over-month and year-over-year safety trends
How Telematics Insurance Integration Works
From initial connection to premium savings, here's the complete step-by-step process that earns fleets 12-25% reductions. FleetRabbit handles all the technical complexity — you focus on running your fleet safely while we build the data profile that earns your discount. The entire process typically takes 4-6 months from connection to first premium reduction.
Connect Your Existing Telematics
Day 1-3Link your existing GPS, ELD, or telematics devices to FleetRabbit through our integration layer. We connect with all major hardware providers including Samsara, Geotab, Verizon Connect, Omnitracs, KeepTruckin, Platform Science, and dozens more. No new hardware purchases required — FleetRabbit works with your current technology investment. Data typically begins flowing within hours of completing the connection process.
Establish Baseline & Begin Improvement
Months 1-3FleetRabbit calculates your fleet's initial safety scores across all key metrics and identifies the highest-impact improvement opportunities. Implement targeted driver coaching based on specific behavior data — drivers receive real-time feedback on speeding, hard braking, and other risky behaviors. Most fleets see 15-25% safety score improvements within the first 90 days through coaching alone, before making any changes to routes, schedules, or operations.
Build Documented Safety History
Months 3-6Accumulate 3-6 months of documented safety performance that demonstrates sustained improvement over time. Insurers want to see that your safety gains are real and sustainable, not just a temporary snapshot. FleetRabbit automatically tracks trends and generates the historical analysis that demonstrates your improving safety trajectory with statistical confidence.
Share Data With Your Insurance Carrier
60-90 Days Before RenewalConnect your insurer through our direct API integrations or provide professionally formatted data exports they can use directly. FleetRabbit packages your safety data in exactly the format insurance underwriting systems require — safety scores, behavior trends, incident summaries, and benchmark comparisons all compiled into a compelling underwriting package that supports your discount request.
Earn Your Premium Discount
At RenewalReceive 12-25% premium reduction based on your demonstrated safety performance during underwriting. Unlike one-time discounts or promotional rates, telematics-based savings compound over time — continued strong safety performance maintains or even increases your discount every renewal cycle. Some forward-thinking insurers now offer mid-term adjustments for fleets showing significant safety improvements.
Claims Protection & Fraud Defense Features
Beyond premium reduction, telematics integration protects your fleet from fraudulent claims and dramatically accelerates legitimate claim resolution. In an era of nuclear verdicts and increasingly sophisticated insurance fraud schemes, this protection often delivers as much financial value as the premium savings themselves. Book a demo to see how claims protection works.
Automated FNOL reduces 72+ hour manual process to just 15 minutes
GPS + video evidence defeats staged accidents and false injury claims
Per year in avoided fraudulent settlements and legal costs
Automated FNOL Reports
G-force sensors detect collisions instantly and trigger automatic report generation. GPS coordinates, vehicle speed, timestamps, weather conditions, and driver information compile automatically — transmitted to your insurance carrier within minutes of any incident.
- Instant collision detection via accelerometer
- Auto-capture of GPS, speed, heading, timestamp
- Direct transmission to insurer API
Video Evidence Integration
Dash cam footage automatically attaches to incident reports with synchronized timestamps. Exonerate your drivers from false claims with irrefutable visual proof of exactly what happened during any incident.
- Forward and cabin-facing camera support
- Automatic timestamp synchronization
- Cloud storage with instant retrieval
Fraud Protection Shield
Staged accidents, exaggerated injuries, and false damage claims are all defensible when you have GPS, speed data, and video evidence proving what actually occurred. Protect your fleet from sophisticated fraud schemes.
- Defeat staged accident schemes
- Counter exaggerated injury claims
- Prove actual vs claimed damages
Compatible Insurance Carrier Partners
FleetRabbit integrates directly with leading commercial auto insurance carriers through API connections and formatted data exports. If your insurance carrier accepts telematics data for underwriting or claims purposes, we can connect and share your safety profile in their required format.
Direct real-time data feed. Automatic premium adjustments based on continuous safety monitoring.
Integrated underwriting data exchange. Supports mid-term premium adjustments for improving fleets.
Fleet safety scoring integration. Automated incident notification and claims data sharing.
Commercial auto telematics program partner. Direct data feed for usage-based pricing.
Formatted underwriting packages. Safety score reports optimized for Hartford requirements.
Risk engineering data exports. Claims documentation and safety trend analysis reports.
Don't see your insurance carrier listed? FleetRabbit generates professional safety reports compatible with any insurer's underwriting process. We'll work with your broker to present your telematics data in the format your specific carrier requires. Contact us to discuss your carrier's data requirements.
ROI Calculator: Premium Savings by Fleet Size
Premium savings scale proportionally with fleet size, but even small fleets see meaningful returns from telematics insurance integration. Here's what real fleets are saving annually based on typical commercial auto rates and documented telematics discount ranges:
Calculations based on average commercial auto premium of $14,200 per vehicle and 20% telematics discount. Actual savings vary based on current premium, fleet safety profile, and insurer participation. Book a demo for your personalized savings estimate.
FleetRabbit's insurance integration saved us $156,000 on our last renewal — a 19% reduction from our previous premium. Our broker said it was the most comprehensive safety data package they'd ever presented to underwriters. Beyond the premium savings, the automated accident reports protected us from three fraudulent claims this year that would have cost over $80,000 in settlements. The ROI isn't even close — this pays for itself many times over.
Frequently Asked Questions
Most fleets implementing telematics insurance integration see 12-25% premium reductions, which translates to $2,000-$4,000 saved per vehicle annually depending on your current premium levels. A 50-vehicle fleet typically saves $100,000-$200,000 per year in direct premium costs. Fleets that already have strong safety programs but haven't been sharing data with insurers often see the largest immediate improvements because they're finally getting credit for safety investments they've already made. Additional savings come from reduced claims costs, faster claim resolution, and fraud protection — benefits that can add another 10-15% in total insurance-related cost reduction.
FleetRabbit has direct API integrations with Progressive Commercial, Travelers Insurance, Liberty Mutual, and Nationwide — these carriers receive real-time data feeds and can adjust premiums based on continuous monitoring. We generate professionally formatted underwriting reports for The Hartford, Zurich, Great West Casualty, Old Dominion, and any other carrier that accepts telematics data in their underwriting process. Most major commercial auto insurers now have telematics discount programs, and the number is growing every year as data-driven underwriting becomes industry standard. If your current carrier doesn't accept telematics data, we can help you identify carriers offering better rates for data-sharing fleets.
You control exactly what data gets shared with your insurer. Standard telematics insurance integrations share aggregated fleet-level safety metrics: overall fleet safety scores, speeding percentages, harsh braking and acceleration frequencies, total mileage, time-of-day driving distribution, and maintenance compliance rates. Individual driver data is typically anonymized unless you specifically opt in to driver-level sharing. You can review exactly what data will be transmitted before enabling any insurer connection. FleetRabbit never shares data without your explicit authorization, and you can modify or revoke sharing permissions at any time through your account settings.
You control when data sharing begins with your insurer — FleetRabbit never automatically transmits data without your authorization. We strongly recommend building 60-90 days of improved data with driver coaching before engaging insurers. Most fleets see meaningful safety score improvements within the first quarter just from implementing coaching alerts and driver feedback. Start by establishing your baseline, implement improvements, document the positive trend, then share with your insurer when you have a compelling safety story to tell. This approach ensures your first data submission demonstrates your fleet's best performance and strongest safety trajectory.
Premium adjustments typically apply at your policy renewal date, so timing matters. Start telematics data collection 6+ months before your renewal to build a compelling safety profile with documented improvement trends. Some progressive insurers offer mid-term premium adjustments for fleets demonstrating significant safety improvements — ask your broker about early adjustment options. For new policies, many insurers will quote telematics-based rates immediately if you can provide 3-6 months of historical data from FleetRabbit. The fraud protection and claims acceleration benefits begin immediately upon implementation, even before you see premium reductions.
No — FleetRabbit integrates with your existing telematics hardware. We connect with over 50 GPS and ELD providers including Samsara, Geotab, Verizon Connect, Omnitracs, KeepTruckin, Platform Science, CalAmp, and many others. If you're already using any commercial fleet tracking system, we can pull data from it without any hardware changes. For fleets without existing telematics, we can recommend cost-effective hardware options, but insurance integration works best when you can leverage equipment you already have deployed and generating data.
FleetRabbit monitors accelerometer data from your telematics devices to detect collision events in real-time. When a significant impact is detected, the system automatically captures GPS coordinates, vehicle speed, heading, timestamp, driver identification, and other relevant data. If you have integrated dash cameras, video footage is automatically attached to the incident report. The complete First Notice of Loss (FNOL) package is generated within minutes and can be transmitted directly to your insurance carrier through API connections or emailed as a formatted report. This eliminates the delays, incomplete information, and memory gaps that plague traditional manual incident reporting processes.
Yes — fraud protection is one of the most valuable benefits of telematics insurance integration. When someone files a claim against your fleet, you have GPS data proving exact vehicle location and speed, timestamps documenting the sequence of events, and video footage (if cameras are integrated) showing what actually happened. Staged accidents typically fall apart when confronted with this evidence. Exaggerated injury claims become difficult to sustain when data shows a low-speed impact. Fleets using comprehensive telematics see 67% reduction in successful fraudulent claims. In nuclear verdict situations, having irrefutable data can mean the difference between a defensible case and a catastrophic settlement.
Stop Overpaying — Your Safety Record Deserves Recognition
Your fleet's safety investments deserve to be recognized with lower premiums. See exactly how much telematics data sharing could save your fleet at your next renewal.
Free for 3 vehicles · No credit card required · Full setup in under 2 weeks