Equipment uptime is the single most consequential variable in mining profitability. A haul truck running at 92% availability and a haul truck running at 78% availability are not separated by engineering — they are separated by how they are managed. At $5,000 to $20,000 per hour of downtime for ultra-class trucks, and with major breakdowns costing up to $2 million per day in lost production, the difference between those two availability figures can mean tens of millions of dollars per year for a mid-sized surface mine. The operations achieving world-class uptime — 92 to 94% availability on haul trucks and 90 to 92% on shovels — are not running newer equipment than their competitors. They are running better data systems, smarter maintenance triggers, and real-time analytics that surface problems before they surface as breakdowns.
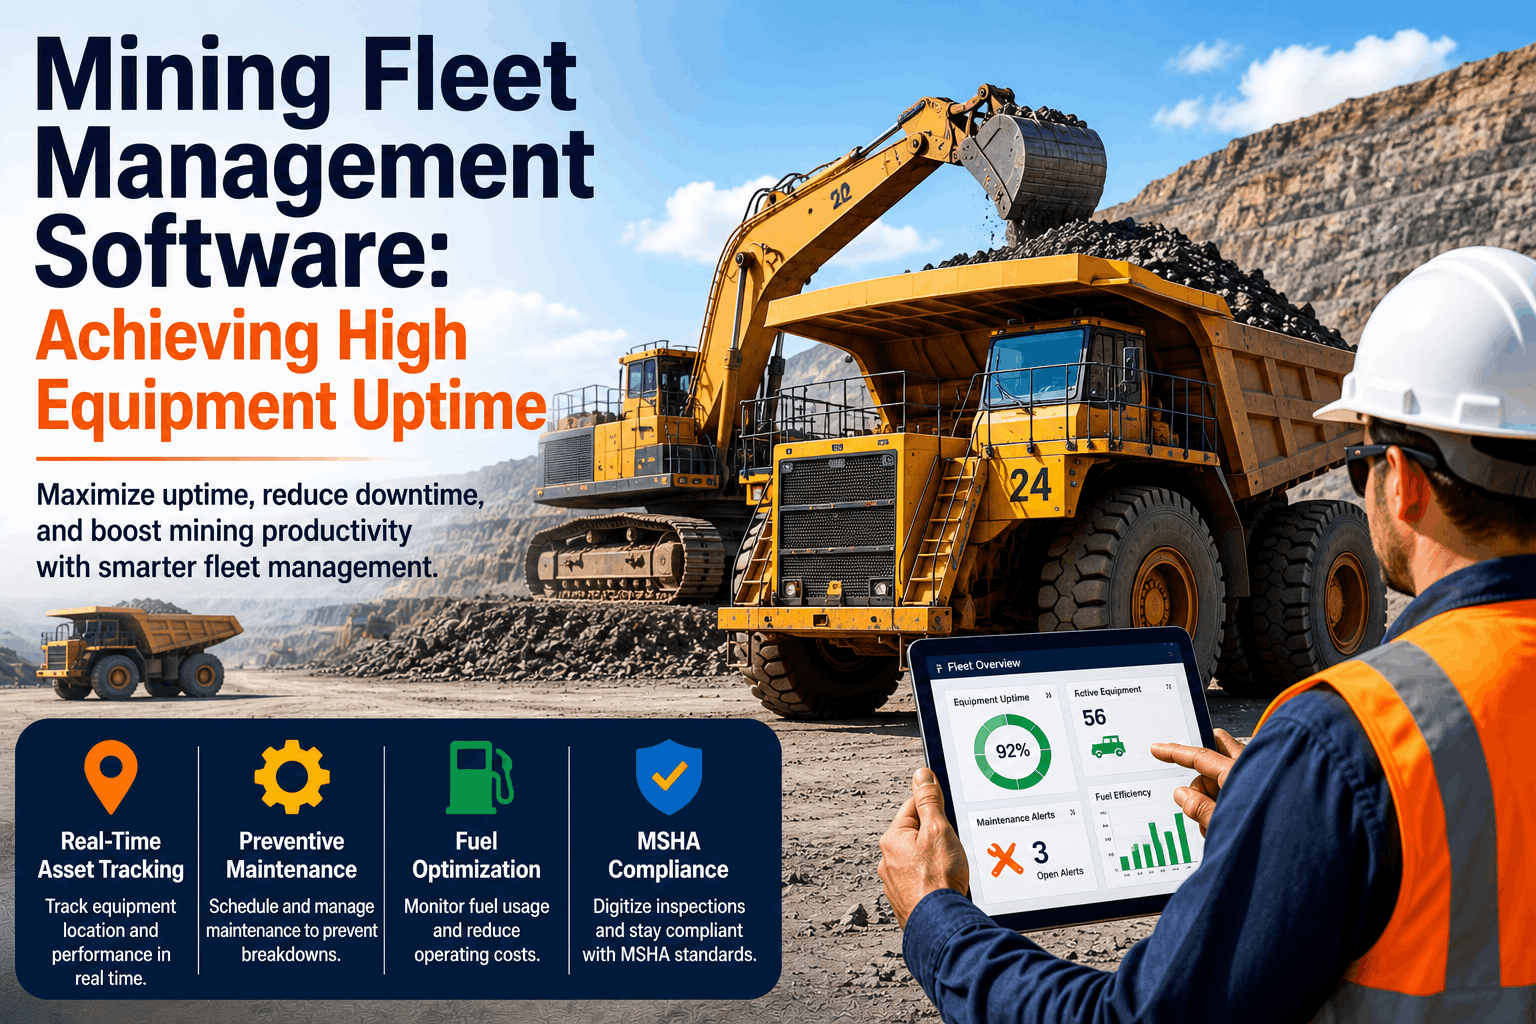
Mining Fleet Management Software: Achieving High Equipment Uptime
Real-time analytics, hour-based maintenance triggers, and predictive failure alerts are closing the uptime gap between average and world-class mining operations — one machine at a time.
The Uptime Gap: Why Most Mines Operate Below Potential
The gap between the industry average equipment availability of 72 to 78% and the world-class benchmark of 92 to 94% is not explained by equipment age or brand — it is explained by maintenance strategy. The average mine operates on a reactive or loosely preventive model: equipment runs until a fault code triggers, a technician responds, parts are sourced, and the machine is repaired. This sequence costs 4 to 5 times more than the equivalent repair performed proactively, and every hour the machine sits idle is production that cannot be recovered.
The mines operating at world-class availability have replaced this sequence with a data-driven model. Maintenance is triggered by condition — engine hours, sensor thresholds, fault pattern recognition — not by breakdowns or arbitrary calendar intervals. Parts are on-site before the work order is generated because the system predicted the need weeks in advance. Technicians walk into the shop knowing exactly what they are repairing because the AI has already surfaced the probable root cause from sensor data. This is not a vision for 2030 — it is the operating reality of leading mining operations today, enabled by platforms that connect telematics, AI analytics, and maintenance workflows into a single integrated system. Sign up with FleetRabbit to connect your mine's equipment data to a predictive uptime platform built for surface mining conditions.
How Real-Time Analytics Drive Equipment Uptime
Modern mining equipment is instrumented at a level that was unimaginable a decade ago. A single haul truck carries 200 or more onboard sensors monitoring exhaust temperature, hydraulic pressure, engine load, payload weight, transmission oil condition, tire pressure, and dozens of other parameters — generating a continuous stream of operational data every second it operates. The mines that convert this data stream into uptime gains are the ones with analytics platforms capable of processing it in real time and surfacing actionable intelligence rather than raw numbers.
Current AI predictive maintenance systems trained on mining equipment data can predict equipment failures with 80% or greater accuracy, often 3 to 28 days before they occur. A recent study applying machine learning to haul truck sensor data — monitoring 45 parameters including exhaust temperature, pressure, and engine load — successfully identified failing components days before breakdown across a fleet of production trucks. This lead time is precisely what converts a catastrophic mid-shift failure into a planned shop visit. Book a FleetRabbit demo to see how real-time sensor analytics apply to your specific fleet and equipment mix.
The Four Uptime Drivers Fleet Software Must Address
Mining fleet management software achieves high equipment uptime by systematically addressing four interdependent factors that determine whether a machine is available and productive on any given shift. Each factor has a measurable impact on availability, and each requires a different data capability to optimize. The platforms that deliver across all four are the ones driving 92-plus percent availability at world-class operations.
Hour-triggered PM schedules — at 250, 500, 1,000, and 2,000 operating hour intervals — automatically generate work orders before intervals are exceeded. Shift-aware scheduling fits PM into planned shutdowns rather than arbitrarily interrupting production. PM compliance above 85% is the single highest-leverage driver of availability improvement available to any mine fleet manager.
Current industry average MTBF is 400 to 600 hours for excavators and loaders. World-class operations achieve 800-plus hours through predictive maintenance programs that intercept developing failures before they cause breakdown. MTBF improvements of 50 to 100% are achievable with systematic digital maintenance, representing $45,000 to $75,000 annual savings per 10-machine fleet through reduced breakdown frequency alone.
When a breakdown occurs, repair speed determines how much production is lost. Best-in-class operations achieve MTTR under 6 hours versus the industry average of 12 to 18 hours. The difference is pre-diagnosis: when the analytics platform has already identified the probable root cause and generated a parts list, technicians do not spend half their time on diagnosis — they walk in repair-ready.
A truck at 90% mechanical availability but 65% utilization is leaving significant value on the table. Utilization tracks what percentage of available hours are spent in productive operation — not idle in a queue, waiting for a shift change, or waiting for operator assignment. Real-time equipment location and status dashboards expose utilization bottlenecks that shift planning alone cannot identify.
FleetRabbit delivers hour-based PM scheduling, real-time sensor analytics, predictive failure alerts, and live equipment utilization dashboards — purpose-built for surface mines and quarries.
Key Performance Indicators Every Mine Fleet Manager Should Track
The shift from reactive to predictive maintenance requires a parallel shift in which metrics a mine tracks and how frequently they are reviewed. The KPIs that govern equipment uptime are not annual figures reviewed in board presentations — they are shift-level and daily metrics that require real-time visibility to be actionable. Mining fleet software that surfaces these metrics continuously — not in weekly spreadsheet exports — is the infrastructure that separates high-uptime operations from the rest.
These KPIs are most valuable when reviewed at shift frequency, not monthly. Equipment down for more than 30 minutes is a shift-level exception that should trigger an immediate response — not a line item in next week's report. Mining fleet management software that pushes shift-level KPI exceptions to site managers in real time is the operational infrastructure that makes world-class uptime achievable. Sign up with FleetRabbit and start monitoring your mine's uptime KPIs in real time from your first shift on the platform.
Hour-Based Scheduling: Why Mileage and Calendar Don't Work in Mining
Mining equipment does not age by distance or calendar days — it ages by engine hours under load. A haul truck running full production at a large open-pit mine can accumulate 600 or more operating hours in a single month — the equivalent of two years of typical driving compressed into 30 days. An excavator working three shifts in hard rock conditions wears its swing gearbox, bucket cylinders, and track components at a rate that bears no relationship to calendar weeks. Scheduling PM at 90-day intervals for machines operating at this intensity guarantees that some intervals are serviced too late and others too early — neither outcome is optimal.
Hour-triggered scheduling changes this entirely. When a fleet management platform syncs engine hours directly from OEM telematics — Cat MineStar, Komatsu KOMTRAX, Volvo CareTrack — and generates PM work orders the moment a machine approaches its next service threshold, the maintenance calendar becomes a continuous, asset-specific plan that reflects how each machine is actually aging in its specific operating conditions. Tiered intervals at 250, 500, 1,000, and 2,000 hours — adjusted for severe duty as needed — replace the blunt instruments of calendar scheduling. Book a FleetRabbit demo to see how hour-based PM scheduling integrates with your OEM telematics systems across your specific equipment fleet.
The Financial Case: What Every Percentage Point of Uptime Is Worth
The financial translation of uptime improvement from percentages to dollars is what makes the investment case for mining fleet management software immediately compelling. For a 20-truck haul fleet operating at a mine generating $500,000 per day in ore revenue, moving from 76% to 86% equipment availability — a 10 percentage point improvement — recovers approximately 2 additional productive hours per truck per day across the fleet. At a conservative production value of $2,500 per operating truck-hour, that recovery is worth $50,000 per day in additional throughput.
The maintenance cost side of the equation adds further. World-class maintenance performance improvements — from current industry averages to best-in-class benchmarks — generate $85,000 to $135,000 annual savings per 10-machine fleet through reduced emergency repairs, improved availability, and optimized parts usage. MTBF improvements of 50 to 100% through predictive maintenance programs represent $45,000 to $75,000 additional savings per 10-machine fleet. The fleet management software investment required to drive these outcomes — platform subscription, hardware, and implementation — is typically recovered within the first operating quarter at mid-sized mining operations. Start your free FleetRabbit account and begin calculating your mine's specific uptime improvement potential today.
FleetRabbit's mining uptime platform gives your maintenance team the analytics, scheduling, and predictive tools that world-class mining operations run on — without the enterprise complexity or the enterprise price tag.