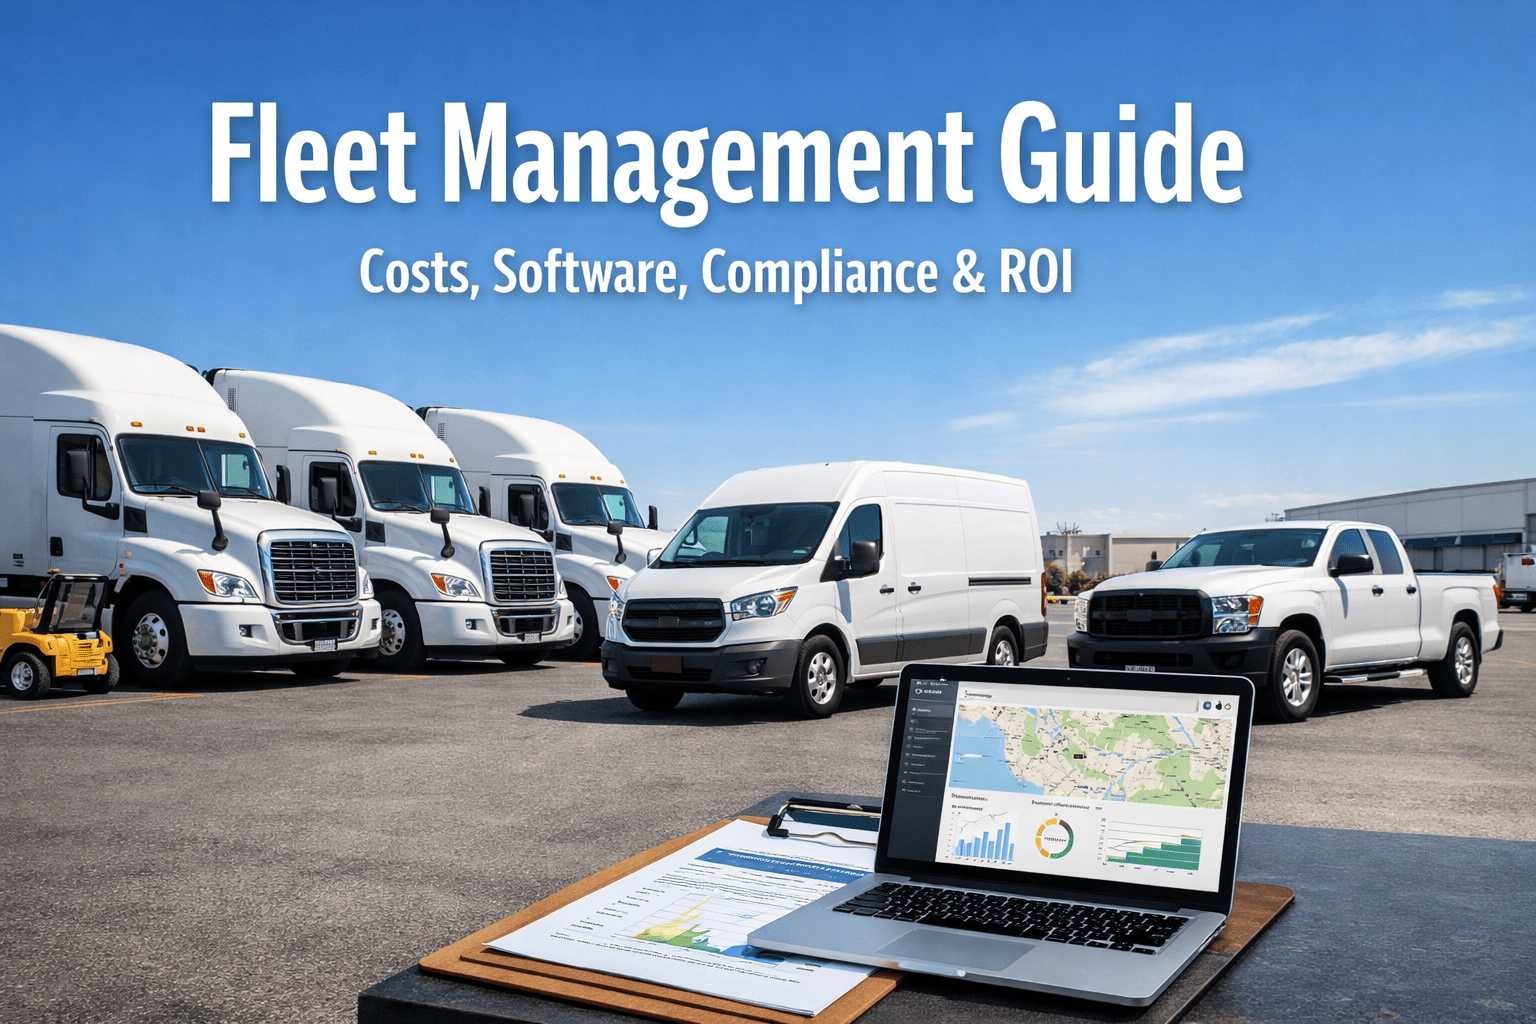
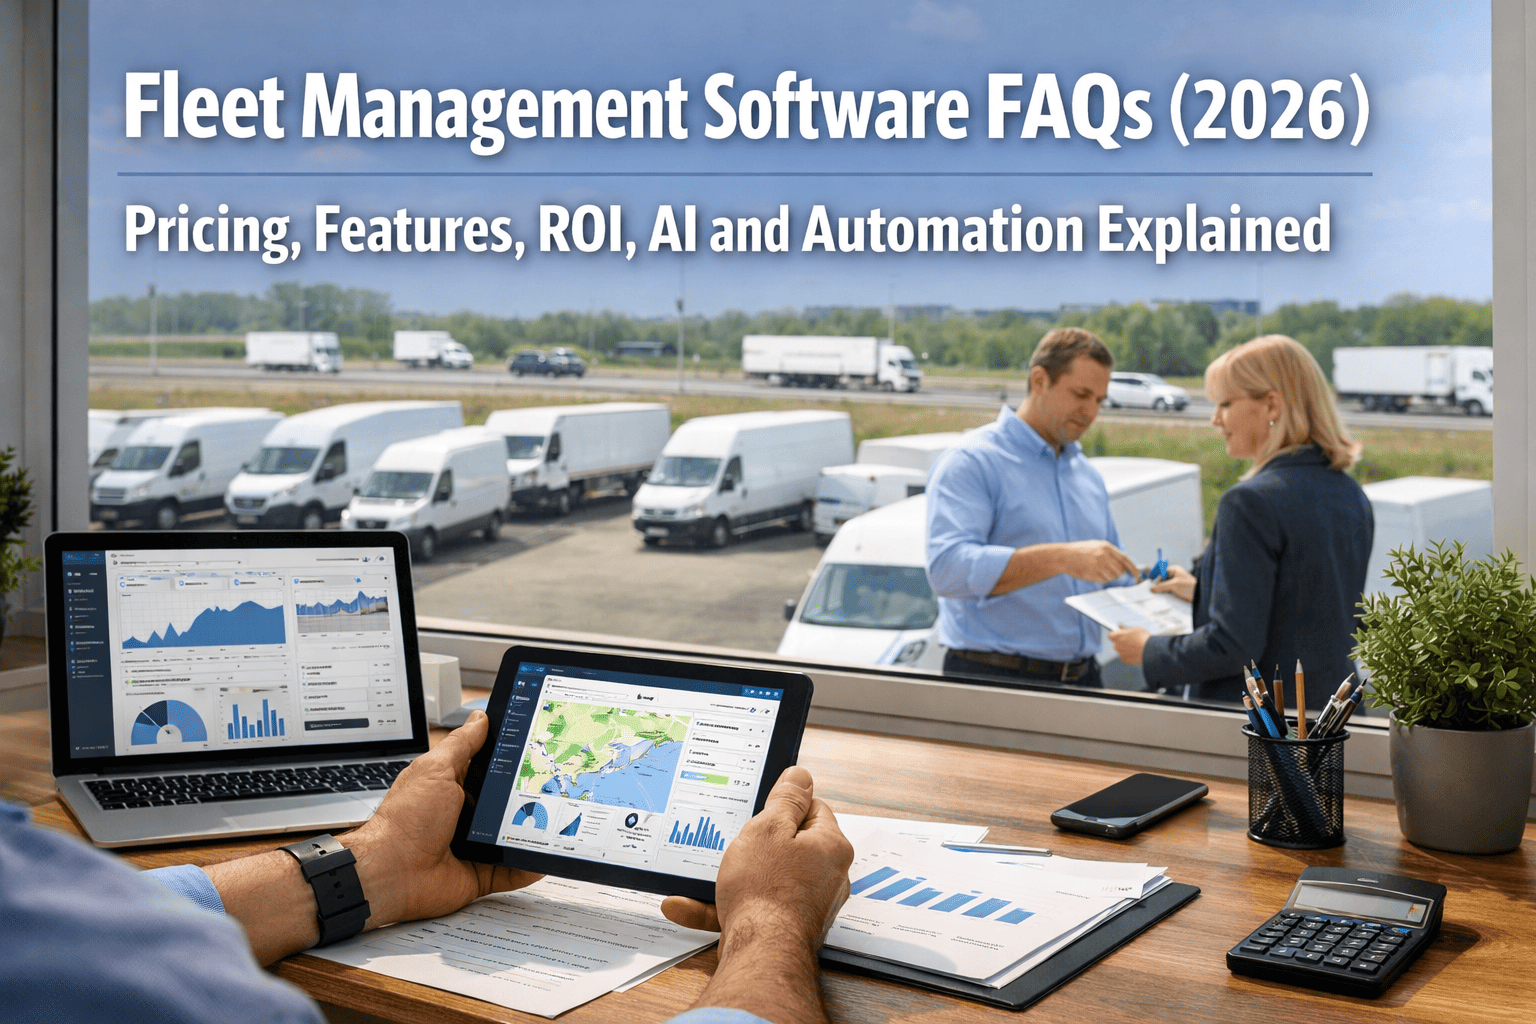
This comprehensive FAQ guide answers the top 11 questions fleet managers are asking about fuel management and efficiency in 2026, covering proven strategies to reduce fuel costs by 15-30%, optimize fleet operations, and implement data-driven practices that deliver measurable ROI within 90 days. With fuel representing 21-30% of total fleet operating costs according to the 2025 ATRI Operational Costs of Trucking report, mastering these best practices transforms your largest controllable expense into a competitive advantage. Start optimizing your fleet fuel management today - takes just 15 minutes.
Transform Your Fleet Fuel Management in 2026
Join thousands of fleet operators using intelligent fuel management strategies to cut costs by 15-30%, improve MPG visibility, and make data-driven decisions that impact your bottom line.
Frequently Asked Questions
1. What are the most important fleet fuel management best practices for 2026?
The most effective fleet fuel management practices for 2026 combine technology-driven insights with operational discipline to achieve measurable cost reductions. Data-driven fleet management has taken center stage as fleets recognize that real-time insights and visibility go hand in hand with cost savings, operational control, and competitive advantage. Access our complete fuel management framework - ready in 15 minutes:
Top 11 Fleet Fuel Management Best Practices for 2026:
- Detailed fuel tracking monitoring consumption by vehicle, route, and driver to reveal patterns and inefficiencies
- Driver behavior optimization using telematics to reduce aggressive driving, speeding, and excessive idling
- Route optimization leveraging AI-powered software to minimize unnecessary mileage and avoid traffic
- Preventive maintenance programs keeping vehicles operating at peak efficiency to maximize fuel economy
- Fuel card integration enabling real-time transaction monitoring, spending controls, and fraud prevention
- Telematics implementation capturing engine data, driver behavior, and vehicle diagnostics for actionable insights
- Driver training programs teaching fuel-efficient driving techniques that deliver 10-15% savings
- Idle reduction policies implementing automatic shutdown systems and monitoring to eliminate fuel waste
- Load optimization reducing excess weight and improving aerodynamics to boost fuel efficiency
- Data analytics integration combining fuel, maintenance, and operational data for comprehensive visibility
- Electrification planning evaluating EV readiness for vehicles with favorable use cases and TCO profiles
2026 Fuel Management ROI by Best Practice
| Best Practice | Typical Fuel Savings | Implementation Time | ROI Timeline | Key Success Factor |
|---|---|---|---|---|
| Driver Behavior Optimization | 10-20% | 2-4 weeks | 30-60 days | Telematics + coaching |
| Idle Reduction Programs | 5-15% | 1-2 weeks | Immediate | Policy + monitoring |
| Route Optimization | 10-20% | 2-4 weeks | 30-90 days | AI-powered software |
| Preventive Maintenance | 5-10% | Ongoing | 60-90 days | Systematic scheduling |
| Fuel Card Integration | 3-6% | 1-2 weeks | Immediate | Network discounts |
| Combined Impact | 15-30% | 30-90 days | 1-3 months | Systematic approach |
2. How can telematics and data analytics improve fuel efficiency in 2026?
Telematics and data analytics have evolved from basic GPS tracking to comprehensive fleet intelligence platforms that drive measurable fuel savings. Modern systems provide real-time visibility into fuel consumption patterns, driver behavior, asset utilization, and maintenance needs, enabling faster and smarter operational decisions. The vehicle telematics market is projected to reach $170 billion by 2032, reflecting the significant value these systems deliver. Explore telematics integration options - takes 10 minutes:
How Telematics Drives Fuel Efficiency:
- Real-time fuel monitoring tracking actual consumption rates and identifying vehicles with abnormal usage patterns
- Driver behavior analytics measuring speeding, harsh braking, rapid acceleration, and idling that increase fuel waste
- Engine diagnostic integration identifying mechanical issues affecting fuel economy before they become costly problems
- Route efficiency analysis comparing planned versus actual miles to detect unauthorized detours and inefficient routing
- Predictive maintenance alerts scheduling service based on actual condition data rather than arbitrary intervals
- Performance benchmarking comparing individual drivers and vehicles against fleet averages to identify coaching opportunities
- Fuel card correlation matching purchases with vehicle location and consumption data to detect fraud
- AI-powered insights leveraging machine learning to identify optimization opportunities across operations
Telematics-Enabled Driver Behavior Improvements
| Behavior Category | Typical Reduction | Fuel Impact | How Telematics Helps |
|---|---|---|---|
| Speeding Time | 27% reduction | 10-27% savings | Speed alerts, scorecards, real-time coaching |
| Excessive Idling | 30-50% reduction | 5-15% savings | Idle time alerts, automatic tracking, reports |
| Hard Braking Incidents | 9% reduction | 5-10% savings | Event detection, driver coaching sessions |
| Aggressive Acceleration | 15-25% reduction | 5-10% savings | Acceleration monitoring, feedback alerts |
| Overall Risky Driving | 95% elimination | Compound benefits | Focused coaching sessions, incentive programs |
2026 Telematics ROI Statistics:
- 3:1 to 6:1 ROI typically achieved within the first year of implementing fleet tracking with advanced features
- 5-10% fuel consumption reduction through operational improvements enabled by effective fleet management
- Up to 30% reduction in unplanned downtime through predictive diagnostics and optimized service scheduling
- 25% maintenance cost reduction for commercial vehicles equipped with comprehensive telematics systems
- 10-15% overall operational cost reduction reported by fleets using data-driven fleet management strategies
3. What is the 2026 fuel price outlook and how should fleets prepare?
Fuel prices are expected to stabilize through 2026, with analysts projecting diesel averaging around $2.10 per gallon and regular gasoline near $2.82 per gallon. This creates a strategic window for fleets to invest in efficiency improvements while benefiting from more predictable fuel costs. However, smart operators are using this stability to build resilience against future volatility. Schedule a fuel strategy consultation - 30 minutes:
2026 Fuel Price Outlook and Fleet Implications:
- Price stabilization expected with easing crude oil prices and steady production creating cost predictability
- Brent crude projected at $52/barrel in 2026, marking a significant retreat from recent highs
- U.S. crude production remaining near record levels at 13.5 million barrels per day
- Global oil demand expected to rise modestly at about 1 million barrels per day annually through 2026
- Strategic opportunity to reinvest fuel savings into efficiency-building initiatives like telematics and driver training
- Bulk fuel contracts worth evaluating while prices remain favorable to lock in savings
- Economic uncertainty from tariffs and inflation continues to impact overall fleet budgets despite stable fuel prices
Even with stable prices, fuel remains one of the largest controllable expenses. Fleets should use this window to build operational resilience. (Start building your fuel resilience strategy now)
Projected 2026 U.S. Average Retail Fuel Prices
| Fuel Type | 2024 Average | 2025 Average | 2026 Projection | YoY Change |
|---|---|---|---|---|
| Regular Gasoline | $3.52/gal | $3.09/gal | $2.75-2.82/gal | -11% to -22% |
| Diesel | $3.95/gal | $3.45/gal | $2.10-2.50/gal | -28% to -47% |
| Brent Crude Oil | $80/barrel | $62/barrel | $52/barrel | -16% |
4. How can driver training and coaching programs reduce fuel costs?
Driver behavior has a direct and substantial impact on fuel consumption, with studies showing aggressive driving can reduce fuel economy by 15-30% at highway speeds and 10-40% in stop-and-go traffic. Well-structured driver training programs focused on fuel-efficient techniques consistently deliver 10-15% fuel savings while improving safety and reducing vehicle wear. Access driver training resources - takes 10 minutes:
Fuel-Efficient Driving Techniques to Train:
- Smooth acceleration avoiding rapid, aggressive acceleration that can increase fuel consumption by up to 40%
- Speed management maintaining optimal speeds of 55-65 mph where fuel efficiency is maximized
- Cruise control usage maintaining constant speeds on highways to save 5-10% on fuel
- Anticipatory braking coasting before red lights and stops to minimize fuel-wasting hard stops
- Idle reduction limiting idling to 30 seconds or less, as one hour of idling burns 0.8-1.0 gallons
- Proper following distance maintaining space to avoid unnecessary braking and acceleration cycles
- Gear management shifting appropriately to keep engine operating in optimal RPM range
- Pre-trip planning reviewing routes and delivery schedules to minimize unnecessary miles
Effective Driver Training Program Elements:
- Real-time feedback systems providing in-cab alerts for speeding, idling, or harsh driving events
- Performance scorecards using telematics data to create transparent, fair driver rankings
- Targeted coaching sessions addressing specific improvement areas identified through data analysis
- Incentive programs rewarding drivers who meet fuel efficiency targets with bonuses or recognition
- Gamification elements creating friendly competition with leaderboards that boost engagement by 85%
- Regular training refreshers conducting sessions once or twice yearly to reinforce good practices
- Progress tracking monitoring improvement over time to demonstrate program effectiveness
- Cost transparency showing drivers how their habits directly impact company profitability and their potential rewards
Launch Your Driver Fuel Efficiency Program
Transform driver behavior into measurable fuel savings with telematics-powered coaching, scorecards, and incentive programs that deliver 10-15% cost reductions within 90 days.
5. What role does route optimization play in fuel management for 2026?
Route optimization has become essential for controlling fuel costs in 2026, with AI-powered routing software delivering 15-30% fuel savings by reducing unnecessary mileage, avoiding traffic congestion, and planning more efficient multi-stop routes. Modern systems analyze real-time traffic, delivery windows, vehicle capacity, and fuel costs to create routes that minimize both time and fuel consumption. Explore route optimization solutions - takes 12 minutes:
Route Optimization Capabilities for 2026:
- AI-driven routing algorithms considering traffic, weather, delivery windows, and vehicle constraints simultaneously
- Real-time traffic integration enabling dynamic route adjustments to avoid congestion and delays
- Multi-stop optimization sequencing stops to minimize total distance and fuel consumption
- Load matching assigning the closest vehicles to jobs to reduce deadhead miles
- Fuel stop planning identifying optimal fueling locations based on price, route, and tank levels
- Historical pattern analysis learning from past routes to continuously improve efficiency
- Delivery time prediction providing accurate ETAs that improve customer service and reduce rush-driven waste
- Integration with telematics combining planned routes with actual driving data for comprehensive analysis
Route Optimization Impact by Fleet Size
| Fleet Size | Typical Fuel Savings | Planning Time Reduction | Monthly Software Cost | Annual ROI |
|---|---|---|---|---|
| 5-15 vehicles | 15-25% | 40-60% | $200-500 | 300-500% |
| 16-30 vehicles | 20-30% | 50-70% | $400-800 | 400-600% |
| 31-50 vehicles | 20-30% | 60-80% | $600-1,200 | 500-800% |
| 51-100 vehicles | 25-35% | 70-85% | $1,000-2,500 | 600-1,000% |
Route Optimization Statistics for 2026:
- Up to 45% fuel cost reduction achieved by fleets using AI-powered route optimization
- 30-50% driver capacity increase through more efficient route planning and stop sequencing
- 95-98% on-time delivery rates typical for fleets using advanced routing software
- 10-20% mileage reduction through intelligent route planning and real-time optimization
- 30-90 day ROI typically achieved with modern route optimization implementations
- 20-40% planning time reduction freeing dispatchers to focus on exceptions and customer service
6. How should fleets approach electrification and alternative fuels in 2026?
Fleet electrification has moved from experimentation to strategic deployment in 2026, with economics becoming increasingly compelling for certain use cases. Light commercial EVs now deliver up to 13% lower total cost of ownership compared to diesel equivalents, and 87% of fleet operators expect to own EVs within the next five years. However, successful electrification requires careful assessment of which vehicles are suitable candidates. Schedule an electrification readiness assessment - 30 minutes:
EV Readiness Assessment Framework for 2026:
- High annual mileage vehicles prioritize vehicles that drive the most, as more miles equals more fuel savings
- Return-to-base operations EVs excel when vehicles return to depot daily for overnight charging
- Predictable routes consistent daily patterns allow confident range planning without charging anxiety
- Urban and regional haul 150-250 miles per day viable if return-to-base; consider hybrid if routes are variable
- Long-haul trucking (400+ miles/day) range and charging infrastructure gaps remain - keep diesel for now
- Cold climate operations 25-50% range reduction in extreme cold requires careful planning
- Charging infrastructure availability assess depot capacity and public charging along routes
- Total cost of ownership analysis factor fuel savings, maintenance reduction, and available incentives
2026 Fleet Electrification Economics by Use Case
| Vehicle Type | EV Viability | Fuel Cost Savings | Maintenance Savings | TCO Advantage |
|---|---|---|---|---|
| Light Commercial Vans | High | $0.04-0.05/mi vs $0.17 gas | $6,000-12,000 lifetime | Up to 13% lower |
| Urban Delivery Trucks | High | 60-70% fuel cost reduction | 30-40% reduction | Positive within 3-5 years |
| School/Transit Buses | High | 50-60% fuel savings | Significant reduction | Strong with incentives |
| Regional Haul (150-250 mi) | Moderate | 40-50% savings | 25-35% reduction | Case-by-case analysis |
| Long-Haul Trucking | Low (2026) | N/A - infrastructure gaps | N/A | Wait for technology |
Critical EV Fleet Considerations for 2026:
- Charging infrastructure planning is essential - depot charging allows centralized management with overnight Level 2 charging
- Mixed fleet management requires software that tracks both fuel and electricity consumption on unified dashboards
- Driver training needed for EV operation, charging procedures, and range optimization
- Incentive capture federal and state programs can offset 30-50% of vehicle and infrastructure costs
- Grid capacity assessment evaluate electrical infrastructure before large-scale deployment
- Smart charging software optimizes charging schedules to leverage off-peak electricity rates
- Battery monitoring telematics integration essential for tracking state of charge and charging status
Many fleets are pursuing emissions goals through hybrid integration and telematics-driven fuel efficiency tracking when full electrification isn't yet viable. (Start your electrification assessment)
7. What fuel tracking and monitoring systems provide the best ROI in 2026?
Effective fuel tracking systems integrate telematics, fuel cards, and analytics to provide comprehensive visibility into fuel consumption, identify waste, and prevent theft. The most valuable systems combine real-time monitoring with historical analysis to drive continuous improvement. Research shows that the act of tracking fuel KPIs itself drives 60-70% of savings, as drivers improve when they know they're being measured. Implement fuel tracking today - takes 15 minutes:
High-ROI Fuel Tracking Capabilities:
- Real-time fuel level monitoring detecting sudden drops that indicate theft or unauthorized removal
- Fuel card integration automatically capturing transaction data including location, gallons, price, and driver ID
- GPS-verified purchases matching fuel transactions with vehicle location to prevent fraud
- Consumption variance alerts flagging vehicles or drivers with abnormal fuel usage patterns
- Cost-per-mile tracking monitoring true fuel costs normalized across operating conditions
- MPG trend analysis identifying declining performance that signals maintenance needs
- IFTA automation eliminating manual fuel tax calculations and reducing compliance burden
- Benchmark comparisons comparing fleet performance against industry standards
Critical Fuel Metrics to Monitor in 2026:
- Miles per gallon (MPG) the fundamental efficiency metric - track by vehicle, driver, route, and time period
- Idle time percentage target under 10% for most operations; every 10% idle time reduces MPG by approximately 1%
- Cost per mile total fuel expense divided by miles traveled reveals true cost visibility
- Fuel economy variance deviation from expected MPG highlights vehicles needing attention
- Purchase price variance difference between paid price and market average identifies savings opportunities
- Theft/loss percentage discrepancy between purchased and consumed fuel - industry estimates 6% losses for unprotected fleets
A 50-truck fleet losing 6% to theft wastes approximately $150,000+ annually. Software-based monitoring typically pays for itself within the first quarter. (Book a fuel tracking demo)
8. How do preventive maintenance programs impact fuel efficiency?
Well-maintained vehicles operate at peak efficiency, directly impacting fuel consumption. Regular maintenance addressing tire pressure, air filters, engine tuning, and alignment can improve fuel economy by 5-10%, while neglected maintenance causes fuel waste that compounds over time. Preventive maintenance programs also extend vehicle life and reduce costly breakdown repairs. Build your maintenance program - takes 12 minutes:
Maintenance Items That Impact Fuel Efficiency:
- Tire pressure monitoring underinflated tires can reduce fuel economy by 0.2% for every 1 PSI drop
- Air filter replacement clogged filters restrict airflow and reduce engine efficiency by 5-10%
- Engine tuning properly tuned engines operate at optimal efficiency with correct fuel-air mixture
- Wheel alignment misalignment creates drag that increases fuel consumption by 3-5%
- Oil changes fresh oil reduces engine friction; using manufacturer-recommended grades optimizes performance
- Fuel system cleaning clogged injectors and dirty fuel systems reduce combustion efficiency
- Cooling system maintenance engines running hot consume more fuel and risk damage
- Drive belt inspection worn belts increase engine load and reduce efficiency
Preventive Maintenance ROI for Fuel Efficiency
| Maintenance Item | Frequency | Cost Per Service | Fuel Efficiency Impact | Annual Savings (50 trucks) |
|---|---|---|---|---|
| Tire Pressure Checks | Weekly | $0 (driver check) | 2-3% improvement | $15,000-25,000 |
| Air Filter Replacement | Every 15-30K miles | $25-75 | 5-10% improvement | $25,000-50,000 |
| Regular Oil Changes | Every 10-15K miles | $150-300 | 1-2% improvement | $5,000-10,000 |
| Wheel Alignment | Annually | $100-200 | 3-5% improvement | $15,000-25,000 |
| Fuel System Service | Every 30-50K miles | $100-250 | 2-4% improvement | $10,000-20,000 |
9. What are the key fleet fuel management trends shaping 2026?
Fleet management in 2026 is defined by data-driven decision making, rising operational costs pushing efficiency to the forefront, and accelerating technology adoption. Successful fleets are moving from reactive management to proactive, predictive approaches that anticipate problems before they impact the bottom line. Discuss 2026 trends with our experts - 30 minutes:
Top Fleet Fuel Management Trends for 2026:
- Data-driven fleet management taking center stage with real-time insights driving cost savings and operational control
- AI and automation streamlining operations across dispatch, billing, compliance, reporting, and route planning
- Predictive maintenance using real-time data and analytics to identify problems before breakdowns occur
- Electrification acceleration shifting from pilot programs to strategic deployment where economics are favorable
- Hybrid integration as a practical stepping stone for fleets not ready for full electrification
- Cloud-native platforms becoming industry standard with AI-driven analytics and automated decision-making
- Telematics evolution moving beyond GPS tracking to comprehensive operational intelligence
- Sustainability as priority driven by regulations, fuel costs, and corporate ESG commitments
- Driver retention focus as shortages persist, with technology supporting safety and job satisfaction
- Integrated platforms connecting fuel, maintenance, compliance, and operations on unified dashboards
2026 Fleet Management Industry Statistics:
- $116.56 billion projected global fleet management software market by 2032 (19.76% CAGR from $32.34B in 2025)
- 87% of fleet operators expect to own electric vehicles within the next five years
- 72% of fleets now use dedicated fleet management software, up from previous years
- 64% of fleet managers currently use GPS fleet tracking solutions, an 8.5% increase year-over-year
- 45% of fleet managers achieved positive ROI in 11 months or less with fleet management solutions
- 80,000+ driver shortage continues to impact the U.S. trucking industry, driving technology adoption
Stay Ahead of 2026 Fleet Trends
Get the tools and insights you need to capitalize on emerging fleet management trends. From data analytics to electrification planning, position your fleet for success.
10. How can small and medium fleets implement effective fuel management on a budget?
Small and medium fleets often see the highest percentage improvement from fuel management initiatives because they typically lack the sophisticated tracking that larger operations have. With fuel costs representing the same 21-30% of operating expenses regardless of fleet size, even a 5-15 vehicle operation can save thousands annually. Modern cloud-based solutions have made enterprise-grade capabilities accessible and affordable for fleets of all sizes. Get started with affordable fuel management - takes 10 minutes:
Fuel Management Solutions by Fleet Size
| Fleet Size | Recommended Approach | Monthly Investment | Annual Fuel Spend | Expected Savings (15%) |
|---|---|---|---|---|
| 5-15 vehicles | Fuel cards + basic telematics | $200-500 | $250,000 | $37,500 |
| 16-30 vehicles | Integrated fleet management | $400-800 | $750,000 | $112,500 |
| 31-50 vehicles | Full platform + analytics | $800-1,500 | $1,500,000 | $225,000 |
| 51-100 vehicles | Advanced analytics + AI | $1,500-3,000 | $2,500,000 | $375,000 |
Budget-Friendly Fuel Management Strategies:
- Start with fuel cards immediate discounts of $0.05-0.10 per gallon plus transaction tracking and controls
- Implement basic telematics entry-level GPS tracking provides vehicle location, idle time, and basic driver behavior data
- Focus on quick wins idle reduction and driver coaching deliver immediate returns with minimal investment
- Use free fleet benchmarks compare your performance against industry averages to identify improvement areas
- Leverage driver engagement transparent communication about fuel costs and recognition programs cost nothing
- Prioritize maintenance tire pressure checks and air filter changes deliver significant fuel savings at low cost
- Consider scalable solutions choose platforms that grow with your fleet without major cost jumps
- Calculate ROI carefully even small fleets typically see 300-500% ROI within the first year
11. How do I measure and demonstrate fuel management program success?
Demonstrating clear ROI from fuel management initiatives requires systematic tracking of key performance indicators and regular reporting to stakeholders. The best fuel management programs establish baselines, set improvement targets, and track progress using data-driven dashboards that make results visible and actionable. Set up your fuel KPI dashboard - ready in 12 minutes:
Essential Fuel Management KPIs to Track:
- Cost per mile total fuel expense divided by total miles - the primary efficiency metric
- Fleet-wide MPG average fuel economy across all vehicles with trending analysis
- Idle time percentage engine-on time versus moving time, target under 10%
- Driver fuel efficiency scores individual performance rankings to identify coaching opportunities
- Fuel cost variance actual spend versus budget with variance explanations
- Theft/loss percentage discrepancy between purchased and consumed fuel
- Maintenance cost correlation relationship between maintenance compliance and fuel efficiency
- Year-over-year improvement progress against historical baselines
Fuel Management Program Success Metrics
| Success Metric | Baseline Period | Target (90 Days) | Target (6 Months) | Target (12 Months) |
|---|---|---|---|---|
| Cost per Mile Reduction | Establish baseline | 5-8% | 10-15% | 15-25% |
| MPG Improvement | Fleet average | 3-5% | 8-12% | 10-15% |
| Idle Time Reduction | Current % | 20-30% | 40-50% | 50-60% |
| Driver Score Improvement | Initial scores | 10-15% | 20-30% | 30-40% |
| Theft/Loss Elimination | Estimated % | 50% | 80% | 95%+ |
| Program ROI | Investment cost | 100-150% | 200-300% | 300-500% |
Proven Fuel Management Program Results:
- 15% total operating cost reduction within the first year for average U.S.-based fleet adopting efficiency monitoring
- $340,000 annual savings achieved by one fleet through comprehensive KPI dashboard implementation
- 11% efficiency gain in 90 days by identifying 23 underperforming trucks through systematic tracking
- 300-400% ROI typical for fleets within 12-18 months of implementing driver training programs
- 125-150% ROI within two years standard for fleets adopting comprehensive fuel management systems
- $10,000+ annual savings per truck achievable through telematics-based fuel management
Start Your Fleet Fuel Optimization Journey Today
Join thousands of fleet operators who have transformed their fuel costs into competitive advantage. Get real-time visibility, actionable insights, and measurable ROI with comprehensive fuel management tools.