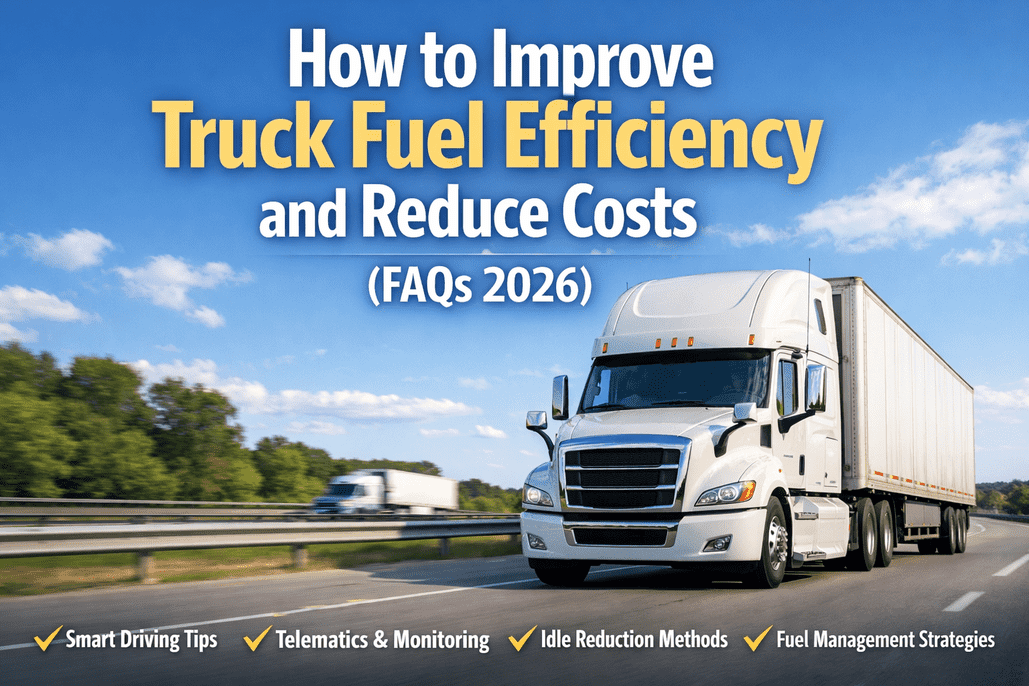
Fuel is the single largest controllable operating cost in trucking — averaging 60% of total fleet budgets and roughly $1.50 per mile for a Class 8 truck in 2024 (ATRI). The average cost of operating a truck hit $2.26 per mile, and with non-fuel costs reaching record highs ($1.779/mile), squeezing more miles from every gallon isn't optional — it's survival. The good news: fleets that combine smart driving practices, telematics intelligence, idle reduction, and data-driven fuel management are cutting fuel costs by 10-16% within the first year. Verizon Connect's 2025 Fleet Technology Trends Report found that fuel savings nearly doubled year-over-year, from 9% in 2024 to 16% in 2025, and 47% of fleets achieved positive ROI on GPS telematics in under 12 months. This FAQ covers the strategies, technologies, and operational habits that turn fuel from a cost center into a competitive advantage. Sign up for FleetRabbit to digitize your maintenance and inspection workflows — the foundation that keeps every fuel improvement locked in.
Turn Fuel From a Cost Center Into a Competitive Edge
FleetRabbit connects digital inspections, maintenance tracking, and defect management into one platform — so tire pressure, filter changes, and aero repairs never silently drain your MPG.
Frequently Asked Questions
What's the real impact of driver behavior on truck fuel efficiency?
Driver behavior is the single most impactful and cost-free lever for fuel improvement. Geotab reports that behaviors like speeding, idling, and harsh braking can impact fuel consumption by up to 30%. The difference between the best and worst drivers in the same fleet, on the same route, in the same truck can exceed $1,000 per week. The key strategies are well-documented — the challenge is making them stick beyond 90 days:
Driver Performance & Fuel Economy
Speed Management
For every 5 MPH over 60 MPH, a truck loses an average of 0.7 MPG. Maintaining optimal speeds of 55-65 MPH can save fleets driving 100,000+ miles annually upward of $10,000 in fuel costs per truck. At 75 MPH, a truck burns 27% more fuel than at 65 MPH. Use cruise control on flat terrain and smart cruise on newer trucks for hill optimization. Progressive shifting at the lowest RPM with adequate torque further reduces consumption.
Acceleration & Braking Patterns
Faster acceleration burns fuel inefficiently by spiking RPM. Hard braking wastes the kinetic energy you already paid for in fuel. Combined aggressive driving behaviors can increase fuel consumption by up to 30%. Anticipating traffic, maintaining following distance, and using progressive braking transforms energy management. In-cab coaching provides real-time feedback — without it, most drivers revert to old habits within 90 days.
Route Optimization
Route planning software uses real-time traffic data and delivery schedules to find the fastest, most fuel-efficient paths. In 2024, U.S. fleets burned $60 billion on fuel, with idling eating up 10% of that — roughly $6 billion. Route optimization drops idle time by 8-10% and reduces empty miles, which averaged 16.7% across the industry in 2024 (ATRI). Every unnecessary mile driven is $2.26 wasted — and it compounds across every truck in your fleet.
How do telematics and data analytics improve fleet fuel efficiency?
Telematics has crossed from nice-to-have to essential — the U.S. fleet management market is projected to reach $35 billion by 2030. Fleets can typically expect an ROI ranging from 3:1 to 6:1 within the first year, and the 2025 Verizon Connect report found that 47% of fleets realized positive ROI on GPS tracking in under 12 months (up from 41% in 2024). Here's how data turns fuel waste into measurable savings:
Telematics-Driven Fuel Management
The financial case is compelling: strategic telematics implementation delivers average annual savings of $3,500-$6,200 per vehicle. For a 50-truck fleet, that's $175,000-$310,000 annually. Yet 85% of fleets collect comprehensive telematics data but analyze less than 30% of it — leaving tens of thousands of dollars in optimization opportunities unused. The difference isn't the technology; it's whether you build the operational discipline to act on what the data tells you. Schedule a FleetRabbit demo to see how digital DVIR and maintenance tracking integrate with your telematics ecosystem.
How much can idle reduction really save a trucking fleet?
Idling is one of the most expensive and most preventable fuel wastes in trucking. Argonne National Laboratory estimates that more than one million long-haul trucks idle during federally required rest periods every day. At an average diesel price of $4 per gallon, a single long-haul truck wastes $4,000-$6,000 in fuel per year from idling alone — and that's before you count accelerated engine wear, oil contamination, DPF soot loading, and shortened component life. NACFE's December 2025 Idle-Reduction Playbook confirms the industry has made major strides, but there's still significant ground to gain:
Idle Reduction Impact Analysis
The average long-haul truck idles 1,800 hours per year. At 0.8-1.0 gallons per hour of fuel consumption during idle, that's 1,440-1,800 gallons burned producing zero miles. Every hour of idle eliminated saves $3-$5 in direct fuel cost. Target: under 25% idle time across your fleet.
According to Navistar's chief engineer, a typical linehaul fleet sees 20-30% idle time annually. But top performers prove it's controllable: Mesilla Valley Transportation cut idle from nearly 50% to 3-4% in winter using 3-minute idle shutdown timers and electric APUs with shore power. That transformation saved thousands per truck annually.
Fuel is just the visible cost. Excessive idling degrades engine oil faster, triggers forced DPF regeneration cycles, accelerates aftertreatment wear, and increases maintenance frequency. When you factor in parts, labor, and shortened component life, the true cost of idling can reach $12,000 per truck annually.
High idle time creates a vicious cycle: excessive soot builds up in the DPF, triggering forced regeneration events that burn additional fuel for 45 minutes to 2 hours each. These regens happen during driving, costing an additional 0.5 MPG on top of the direct idle waste. APUs, idle shutdown timers, and shore power break this cycle.
Track Idle Time and Maintenance Together
FleetRabbit's digital platform connects driver inspection reports with maintenance scheduling — so idle-related issues like DPF loading, oil degradation, and component wear get flagged and addressed before they compound.
What vehicle maintenance practices have the biggest fuel efficiency payoff?
Preventive maintenance is the silent guardian of fuel economy. A truck with properly inflated tires, clean filters, fresh oil, and intact aerodynamic components can achieve 10-11 MPG on highway routes. The same truck with deferred maintenance can silently lose 8-12% of that efficiency — 1,200-1,800 gallons wasted per year. Here's what delivers the biggest return:
High-Impact Maintenance for Fuel Efficiency
Tire Pressure & Specification
Under-inflated tires reduce fuel economy by up to 3% (U.S. DOE). Every PSI below target costs 0.2% in MPG. Only 46% of commercial tires are within 5 PSI of target (FMCSA), meaning more than half the trucks on the road are burning extra fuel right now. TPMS systems improve fuel economy by ~1.4% and cost as little as $15-$25 per sensor. Low rolling resistance tires add another 2-4% improvement.
Aerodynamic Integrity
A damaged or missing fairing, cab extender, or trailer skirt disrupts airflow and can cost 4-6% in fuel efficiency at highway speeds. These components get damaged in yard maneuvers and dock strikes — and often go unreported for weeks. At 100,000 miles and 7 MPG, a 5% loss equals 714 extra gallons, or roughly $2,620 per year. Digital DVIRs catch these defects every day.
Oil & Filtration
Switching from 15W-40 to 10W-30 CK-4 saves 0.5-1.5%. FA-4 lubricants for 2017+ trucks add another 0.4-0.7% — up to 2.2% total improvement. Clogged air filters force rich fuel mixtures, costing ~2% MPG. At $45,000 in annual fuel spend, a 2% improvement saves $919 per truck. Across 100 trucks: $91,900 annually from an oil and filter change.
Alignment & Drivetrain
Misaligned wheels create lateral drag on every revolution. Even 1/8 inch of toe-out on a steer axle creates measurable fuel waste over thousands of miles. Worn injectors produce uneven spray patterns that reduce combustion precision. Annual alignment checks and injector service per OEM schedule pay for themselves in 2-4 months of fuel savings.
Engine Software & Calibration
OEM ECM updates improve fuel mapping, shift logic, and aftertreatment management. Predictive cruise control — now standard on most new Class 8 trucks — adjusts throttle based on terrain data. Keeping engine software current through dealer updates can improve fuel economy 1-3%. Telematics platforms like Cummins Connected and Detroit Connect provide prognostic alerts that catch degradation early.
How should fleets build a data-driven fuel management strategy?
The most fuel-efficient fleets don't rely on one silver-bullet solution — they build layered systems where telematics, maintenance discipline, driver coaching, and procurement strategy reinforce each other. The NACFE found that 14 study fleets operating 75,000 trucks saved $512 million in 2023 compared to national average performance. The difference between average and excellent isn't technology alone — it's the operational discipline to act on what the data reveals:
Building the Fuel Efficiency Technology Stack
Digital Inspection & Maintenance Platform
Paper DVIRs get filed and forgotten. Digital platforms like FleetRabbit ensure every inspection is completed, every defect documented with photos, and every repair triggers an automated workflow. This catches fuel-draining issues — low tires, damaged fairings, fluid leaks — before they compound. This is the foundation because without maintenance discipline, every other technology investment degrades over time.
Telematics & Fuel Analytics
Real-time fuel tracking per VIN makes consumption visible. Driver scorecards expose speed, idle, and harsh events. Route-level analysis identifies where MPG drops. Fleets that make fuel consumption visible see 3-7% improvement in the first quarter and maintain it through ongoing monitoring. Integration with fuel card data provides a complete picture of spend vs. performance.
Driver Coaching & Gamification
Real-time in-cab feedback sustains good habits beyond the initial 90-day improvement window. Gamification creates competition that keeps engagement high. Without sustained coaching, most behavior improvements fade within 3 months as novelty wears off. The best programs combine real-time alerts with weekly scorecards and monthly recognition.
Predictive Maintenance & TPMS
OEM telematics now provide prognostic alerts for oil condition, filter life, and DTC trends. TPMS eliminates the gap between manual tire checks — catching slow leaks and valve failures in real time. Combined, predictive maintenance and TPMS protect the mechanical efficiency gains that underpin all other fuel improvements. The TPMS market is growing 11-13% CAGR for commercial vehicles.
Procurement & Spec Optimization
The spec decisions made at procurement lock in efficiency for the life of the vehicle. Low rolling resistance tires, SmartWay-verified aerodynamic packages, and right-sized powertrains compound savings over 500,000+ miles. New 2025-era trucks achieve 10-11 MPG highway — buying a new truck can deliver an instant efficiency upgrade over a 10-year-old unit still running at 6.5 MPG.
Start With the Foundation
FleetRabbit gives you the digital inspection and maintenance backbone that protects every technology investment you make. When DVIRs, PM scheduling, and defect tracking work together, fuel efficiency improvements stick.
What ROI can fleets expect from fuel efficiency investments?
Fuel efficiency isn't just a cost reduction — it's the highest-ROI investment most fleets can make. With fuel consuming 60% of operating budgets and the industry operating on thin margins after the freight recession, every percentage point of fuel improvement flows directly to the bottom line. Here's what the data shows across different investment categories: