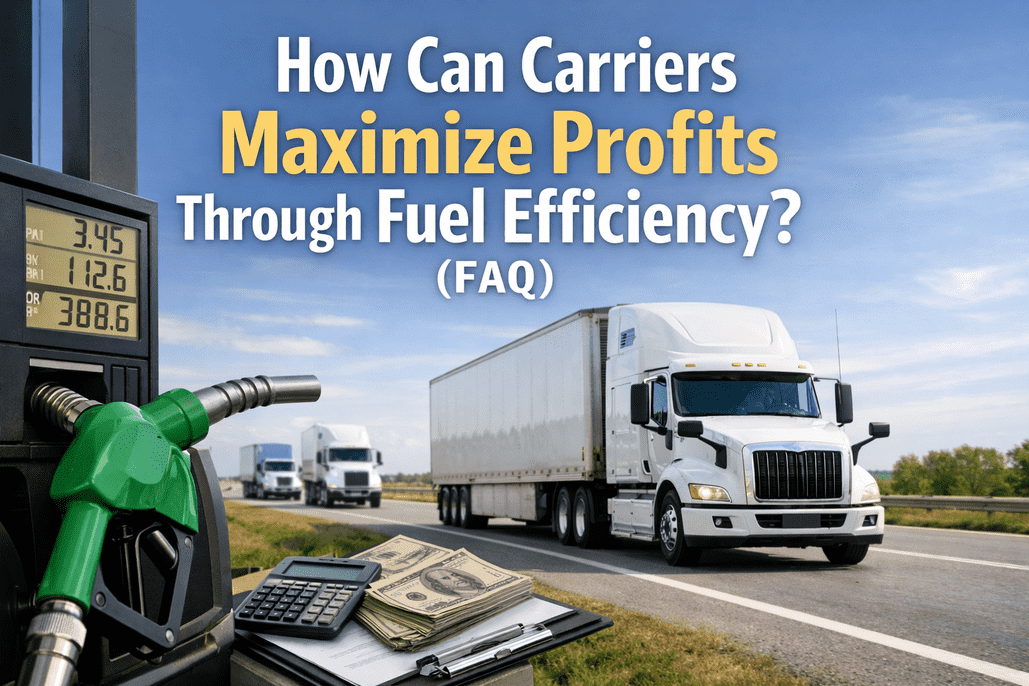
With truckload carriers operating at -2.3% average margins in 2024 and fuel representing 21-24% of operating costs, fuel efficiency isn't just about saving money—it's about survival. The math is stark: every 1% improvement in fuel economy flows directly to your bottom line. For a 50-truck fleet spending $1 million annually on fuel, that's $10,000 in additional profit per percentage point gained—compounding every year. Yet ATRI reports that fleets can reduce fuel consumption by 13-16% through strategic technology adoption, driver behavior programs, and operational optimization. That's $130,000-$160,000 in recoverable profit hiding in plain sight. Sign up for FleetRabbit to start capturing fuel efficiency gains across your fleet.
Turn Fuel Efficiency Into Competitive Advantage
FleetRabbit helps carriers track fuel consumption by vehicle, driver, and route—transforming fuel management from a cost center into a profit driver. Monitor efficiency, prevent fraud, and document savings that improve your operating ratio.
Frequently Asked Questions
Why is fuel efficiency critical for carrier profitability in 2026?
The trucking industry faces unprecedented margin pressure. With rates compressed and non-fuel costs at record highs, fuel efficiency is one of the few levers carriers can control:
Current Industry Reality
Margin Crisis
Average TL operating margin was -2.3% in 2024. Outside of LTL, no trucking sector achieved margins above 2%.
Cost Pressure
Non-fuel operating costs hit record $1.779/mile—3.6% higher than previous year. Total cost per mile: $2.26.
Empty Miles Rising
Empty miles increased to 16.7% of total mileage. That's nearly 1 in 6 miles generating zero revenue while burning fuel.
Fuel Opportunity
Fuel costs declined 7 cents per mile in 2024—the largest YoY change. 2026 diesel projected at $3.50/gallon average.
The Fuel Efficiency → Profit Connection
Unlike revenue increases that require winning competitive bids, fuel savings flow directly to your bottom line with no additional operational requirements.
What are the biggest fuel efficiency opportunities for carriers?
Carriers have multiple levers to improve fuel efficiency—some requiring investment, others requiring only operational changes. Sign up to track your efficiency gains:
Fuel Efficiency Opportunity Matrix
Driver Behavior Programs
- Speed management (10-25% impact)
- Idle reduction training
- Smooth acceleration coaching
- Following distance optimization
Maintenance Optimization
- Tire pressure monitoring
- Air filter maintenance
- Wheel alignment checks
- Engine tuning
Technology Deployment
- Telematics for fuel tracking
- Route optimization software
- Fuel management systems
- Driver scorecards
Equipment Investment
- Aerodynamic devices
- APUs for idle reduction
- Low rolling resistance tires
- Fuel-efficient spec'ing
How can carriers prevent fuel theft and fraud?
Fuel theft costs carriers 5-7% of total fuel spend annually—money that flows directly from your profit margin. With 14% of fleet payments lost to fraud or theft (Motive 2024 data), prevention is essential:
The Scale of Fuel Theft
Common Fuel Theft Methods
External Theft: Siphoning
Physical removal of fuel from tanks. Common in unsecured lots and rest areas.
External Theft: Card Skimming
Devices installed at fuel pumps steal card information for unauthorized purchases.
Internal Theft: Unauthorized Use
Drivers using company fuel cards for personal vehicles or selling fuel to third parties.
Internal Theft: Mileage Creeping
Drivers inflating mileage numbers to justify excess fuel purchases.
Fuel Theft Prevention Technology Stack:
- Fleet fuel cards with driver ID/PIN requirements, spending limits, and location restrictions
- Telematics integration correlating fuel purchases with vehicle location and mileage
- Real-time alerts for unusual transactions, purchases outside geo-fences, or fuel level drops
- MPG monitoring by driver flagging unusually low fuel economy for investigation
- Fuel tank sensors detecting unexpected fuel level changes (siphoning)
ROI example: A fleet spending $500,000 annually on fuel can save $25,000-$35,000 by eliminating theft.
How do fuel cards and purchasing strategies reduce costs?
Strategic fuel purchasing can save $0.45-$2.00 per gallon at discounted locations—significant savings at scale. Book a demo to discuss fuel management integration:
Fuel Card Advantages
Volume Discounts
Negotiate $0.45-$2.00/gallon savings at truck stop networks. Even small fleets can access aggregated pricing.
Spending Controls
Set limits by driver, vehicle, day, time, and location. Prevent unauthorized purchases before they happen.
Transaction Tracking
Real-time visibility into every purchase. Automatic IFTA reporting saves hours of administrative work quarterly.
Fraud Protection
Many cards offer fraud protection up to $250,000. Location verification catches misuse immediately.
Smart Fuel Purchasing Strategies
Route fuel stops into trip planning
Use fuel finder apps to identify lowest-cost stops along planned routes. A 20¢/gallon savings on 200 gallons = $40 per fuel stop.
Avoid premium pricing locations
California and Northeast typically 30-50¢ higher per gallon. Route planning can minimize fueling in high-cost regions.
Partial vs. full fills based on route
Extra weight from full tanks reduces MPG. Calculate optimal fill levels based on next available low-cost stop.
Leverage bulk fuel contracts
Lock in pricing during low-price windows. Element Fleet recommends acting now with diesel at multi-year lows.
What role does telematics play in fuel management?
Telematics transforms fuel management from guesswork to precision. Modern systems provide the data foundation for every other fuel efficiency initiative:
Telematics Fuel Management Capabilities
Real-Time Fuel Consumption
Monitor fuel usage as it happens. Track MPG by vehicle, driver, route, and time period.
Driver Behavior Scoring
Identify speed violations, harsh acceleration, hard braking, and excessive idling that waste fuel.
Idle Time Tracking
Quantify idle hours and cost. Some systems report $5,600+ (8% of fuel spend) wasted on idling per truck annually.
Fuel Purchase Verification
Correlate fuel card transactions with vehicle location and tank levels. Flag discrepancies instantly.
Predictive Maintenance Alerts
Identify issues affecting fuel economy—clogged filters, tire pressure, engine problems—before they compound.
Route Efficiency Analysis
Compare fuel consumption across routes to identify optimization opportunities and avoid fuel-wasting roads.
Telematics ROI for Fuel Management:
- 10-15% fuel efficiency improvement within 3-6 months through driver coaching (AtoB)
- 13-16% total fuel reduction achievable through strategic technology deployment (NACFE)
- $10,000+ annual savings for fleets maintaining optimal speeds of 55-65 MPH vs. 70+ (Geotab)
- Immediate theft detection through fuel level monitoring and purchase verification
Get Complete Visibility Into Fuel Performance
FleetRabbit integrates fuel tracking, driver behavior monitoring, and maintenance management in one platform. See exactly where your fuel dollars go—and where you can save them.
How should carriers approach driver incentive programs for fuel efficiency?
Driver behavior can swing fuel economy by 30% between best and worst performers on identical routes. Incentive programs turn this variance into improvement:
Building an Effective Fuel Incentive Program
Establish Fair Baselines
Set MPG targets by route type, load weight, and terrain. Don't compare mountain routes to flatland hauls.
Make Data Visible
Share individual and fleet-wide fuel performance. Transparency creates accountability without accusation.
Reward Improvement
Incentivize improvement over baseline, not just absolute performance. Everyone can participate.
Share the Savings
Split documented fuel savings with drivers. If a driver saves $200/month in fuel, pay them $50-100. Everyone wins.
Key Behaviors to Incentivize:
- Speed compliance Every mph over 60 costs 0.1 MPG. Reward drivers who maintain policy speeds.
- Idle reduction Set idle percentage targets. Top performers should be under 15% idle time.
- Fuel economy achievement Track MPG by driver against route-appropriate benchmarks.
- Pre-trip tire checks Document tire pressure compliance. Underinflation costs 0.5-1% fuel economy per 10 psi.
- Smooth driving scores Telematics can score acceleration/braking patterns objectively.
What operational changes reduce fuel consumption?
Beyond driver behavior and technology, operational decisions significantly impact fleet fuel efficiency:
Operational Fuel Efficiency Strategies
Reduce Empty Miles
Every deadhead mile burns fuel without revenue. Use load boards, backhaul partnerships, and strategic dispatch to minimize empty running. A 5% reduction in empty miles can improve profitability by 2-3%.
Optimize Route Planning
Avoid traffic congestion, construction delays, and inefficient roads. Extra flat miles often cost less fuel than shorter mountain routes. Modern GPS and route optimization save thousands of gallons annually.
Right-Size Equipment
Match equipment to load requirements. Don't run 80,000 lb-rated equipment for consistent 45,000 lb loads. Spec newer trucks for actual duty cycles, not worst-case scenarios.
Optimize Load Factors
Maximize revenue per gallon by optimizing load weights and cube utilization. Empty trailers still create drag—minimize repositioning without loads.
How do aerodynamic devices and equipment choices affect fuel economy?
Aerodynamic drag accounts for up to 50% of fuel consumption at highway speeds. Equipment choices made at purchase persist for the life of the asset:
Aerodynamic & Equipment Fuel Savings
Trailer Side Skirts
Payback: 6-12 months
Trailer Tails
Payback: 12-18 months
Gap Reducers
Payback: 3-6 months
Low Rolling Resistance Tires
Payback: Over tire life
Diesel APU
Payback: 18-24 months
Automatic Tire Inflation
Payback: 24 months
Truck Spec'ing for Fuel Efficiency:
- Engine selection Newer engines with advanced fuel management significantly outperform legacy units
- Transmission choice Automated transmissions optimize shift points for fuel economy
- Axle ratios Spec for actual cruising speeds and loads, not theoretical maximums
- Oil viscosity 10W-30 FA-4 oils provide 1.5-2.2% fuel savings over 15W-40 on compatible engines
- Aerodynamic packages Factory-installed aero features often cheaper than aftermarket
What's the ROI of a comprehensive fuel efficiency program?
A well-executed fuel efficiency program combines multiple strategies for compounding returns. Sign up to start building your program today:
Comprehensive Fuel Efficiency Program ROI
*Based on $1M annual fuel spend. Savings not fully additive—some overlap exists between categories. Conservative implementation typically achieves 15-20% total reduction.
Implementation Priority Order
Quick Wins (Weeks 1-4)
- Implement fuel card controls and discounts
- Activate telematics fuel tracking features
- Communicate speed/idle policies to drivers
- Verify tire pressure compliance
Build Foundation (Months 2-3)
- Establish driver fuel performance baselines
- Launch driver scorecard program
- Integrate fuel card data with telematics
- Identify theft/fraud patterns
Optimize & Scale (Months 4-6)
- Roll out driver incentive program
- Implement route optimization
- Evaluate equipment investments
- Document ROI for continued investment
How do successful carriers benchmark fuel performance?
Benchmarking provides context for your fuel performance and identifies improvement opportunities:
Fuel Efficiency Benchmarking Framework
Fleet-Wide MPG
Track overall fleet fuel economy over time. NACFE study fleets average 7.77 MPG vs. national average of 6.9 MPG.
Fuel Cost Per Mile
ATRI reports $0.419/mile average in 2024. Calculate yours by dividing total fuel spend by total miles.
Idle Percentage
Top performers maintain under 15% idle time. Industry average often exceeds 25%.
Driver MPG Variance
Compare drivers on similar routes. 30%+ variance between best and worst indicates coaching opportunity.
NACFE Fleet Fuel Study Insights:
- Top-performing fleets (75,000 trucks) achieved 7.77 MPG average in 2023
- $512 million saved compared to average trucks on the road
- Higher technology adoption correlates directly with better MPG
- No single technology dominates success comes from comprehensive approach
What fuel efficiency trends should carriers watch in 2026?
Several developments are reshaping fuel management for forward-thinking carriers:
Emerging Fuel Efficiency Trends
AI-Driven Fuel Optimization
Machine learning analyzes consumption patterns, predicts maintenance needs, and optimizes routes automatically. Early adopters report 5-10% additional savings.
Lower Viscosity Engine Oils
PC-12 oils (FB-4/CL-4) launching January 2027. 10W-30 and 5W-30 formulations gaining traction for 1.5-2.2% fuel savings.
Integrated Fuel Management Platforms
Consolidating fuel cards, telematics, and maintenance data into single platforms. Enables correlation and optimization across systems.
Alternative Fuel Options
Biodiesel, renewable diesel, and natural gas provide cost/emission alternatives. EVs gaining viability for specific applications.
Predictive Analytics
Systems that forecast fuel needs, identify emerging inefficiencies, and recommend proactive interventions before problems compound.
Driver Assistance Systems
Advanced ADAS features including adaptive cruise control and automated following distance improve fuel efficiency while reducing driver workload.
Start Your Fuel Efficiency Program Today
With margins at historic lows and every cost scrutinized, fuel efficiency is no longer optional—it's essential for survival. FleetRabbit provides the visibility, tracking, and management tools carriers need to capture available savings and improve operating ratios.