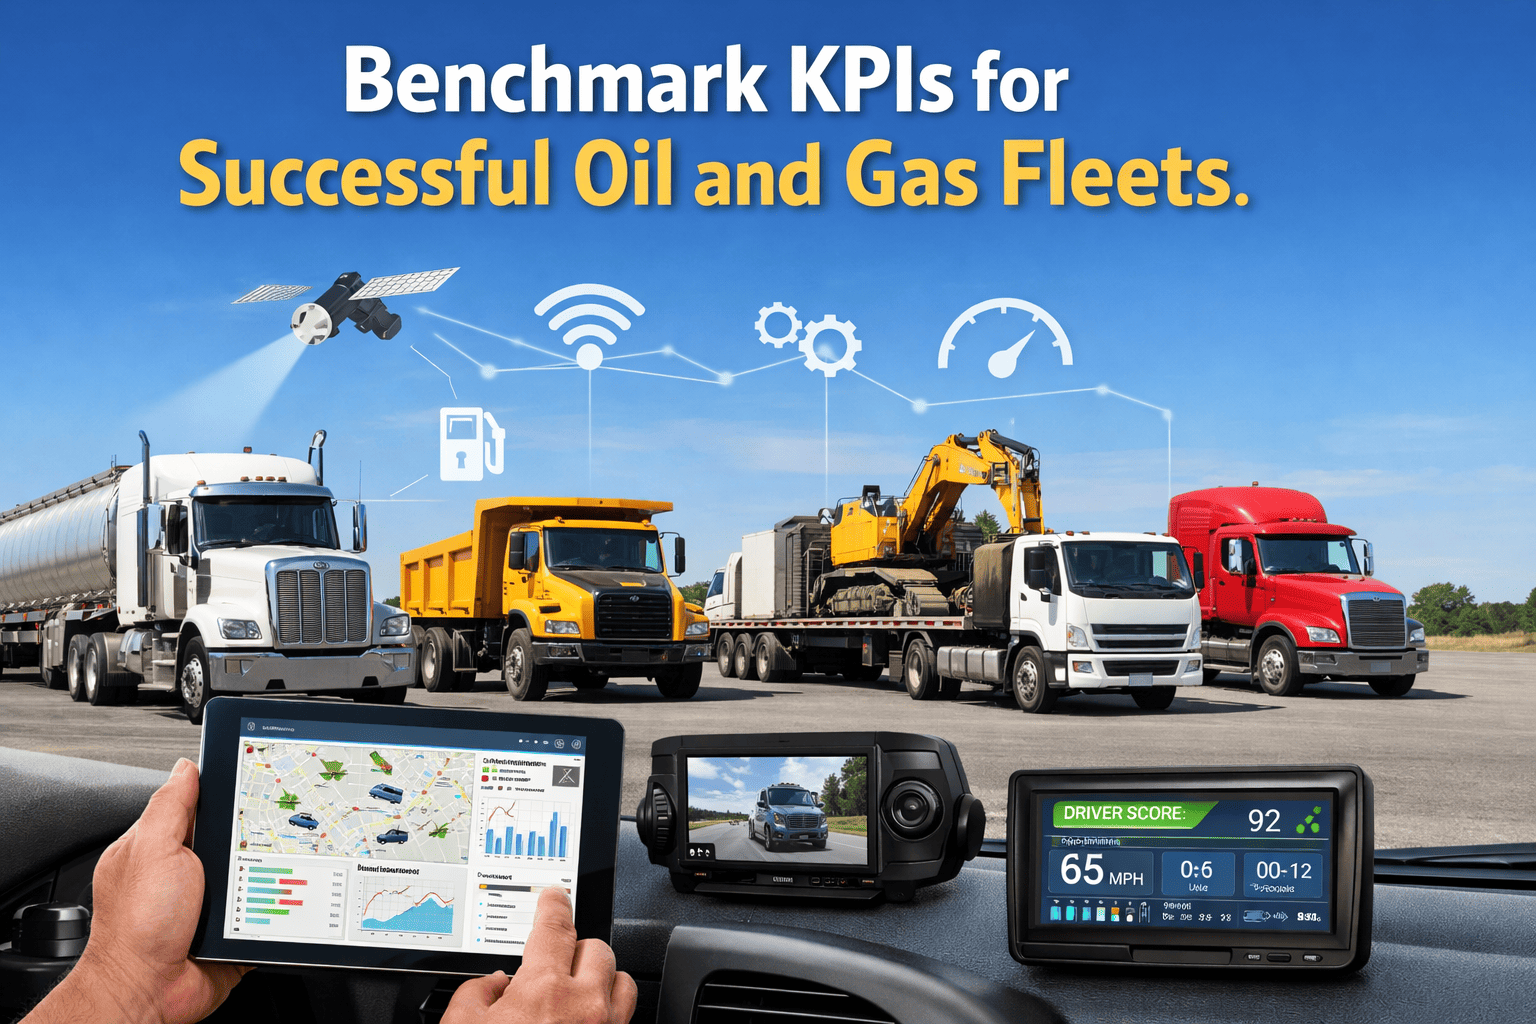
Oil and gas fleet operators managing complex multi-site operations across remote regions make critical maintenance, deployment, and capital investment decisions every week based on one fundamental question: how is my fleet performing against industry standards? Without context — without knowledge of what constitutes "good" performance in oilfield environments — operators risk massive opportunity costs. A drilling operator might consider 92% equipment availability "acceptable" when industry median across comparable fleets is 97%. A service fleet manager might budget $18,000 annually per vehicle for maintenance costs without realizing peer operators average $12,400. Invisible performance gaps like these accumulate into millions of dollars annually in unnecessary downtime, emergency response costs, and capital inefficiency. Book a demo to see how FleetRabbit's KPI benchmarking compares your fleet against industry standards and identifies performance improvement opportunities.
Guide
Benchmark KPIs for Successful Oil and Gas Fleets: Essential Performance Indicators for Safety, Uptime, and Cost Control in Oilfield Operations
19 min read
Why KPIs Are Critical: The Business Case for Fleet Performance Tracking
Fleet performance metrics exist to answer three fundamental business questions that every fleet manager and operations director confronts daily: (1) Are we operating as efficiently as peers in our region and duty cycle? (2) Where are our biggest cost drivers and safety risks? (3) What improvements would generate the highest ROI?
Without benchmarking data, these questions remain unanswerable. Fleet managers operate in the dark, responding to crisis after crisis but never understanding whether underlying operations are inherently inefficient or whether visible problems are actually outliers. Benchmarked KPIs transform this: performance gaps become quantifiable, improvement priorities become defensible, and investment decisions become evidence-based.
$2.1M
Average annual cost opportunity identified when 28-rig fleet adopts KPI benchmarking (typical size fleet)
18-24mo
Typical payback period for fleet optimization initiatives prioritized via KPI benchmarking analysis
4-6 metrics
Number of KPIs that typically show >5% performance gap vs industry median at first benchmarking analysis
Core KPI Categories: The Three Dimensions of Fleet Performance
Successful fleet operations require balanced performance across three interconnected dimensions. Safety KPIs protect people and regulatory compliance. Utilization KPIs drive revenue and cost efficiency. Downtime KPIs measure operational reliability and capital productivity. Imbalance across these dimensions creates hidden risks: maximizing uptime without safety discipline generates incidents; pursuing lowest costs without utilization focus wastes capital; safety culture without operational metrics becomes complacency.
Focus: Personnel protection, regulatory compliance, incident prevention, HSE culture
Lost Time Injury Frequency (LTIF)
Total Recordable Incident Rate (TRIR)
Near-Miss Reporting Rate
Seatbelt Compliance Rate
Vehicle Incident Rate per 100K km
Pre-Trip Inspection Completion %
Business Impact: Insurance premiums, regulatory fines (HSE, OSHA), operational licenses, workforce retention, reputation with contractors and oil companies
Focus: Revenue generation, asset productivity, billable hour capture, fleet efficiency
Fleet Utilization Rate (%)
Billable Hours per Vehicle per Month
Vehicle Idle Time (hours/day)
Revenue per Available Equipment Hour (RAEH)
Asset Turnover Ratio
Cost per Billable Hour
Business Impact: Revenue recognition, return on capital, workforce scheduling efficiency, customer SLA compliance, competitive bidding capability
Focus: Equipment reliability, maintenance effectiveness, planned vs unplanned downtime, component wear
Mean Time Between Failures (MTBF)
Equipment Availability Rate (%)
Unplanned Downtime per Equipment per Month
Planned vs Emergency Maintenance Ratio
First-Time Fix Rate
Maintenance Cost per Operating Hour
Business Impact: Customer uptime guarantees, spare parts investment, technician skill investment, emergency response costs, production continuity
Industry Benchmark Standards: What "Good" Looks Like in Oilfield Operations
The following benchmarks represent median performance across North American oilfield fleets operating in similar duty cycles (drilling operations, service truck fleets, remote site operations). Performance distribution is wide: top quartile operators exceed these standards by 10–20%; bottom quartile operators miss by similar margins. These benchmarks should be your baseline for gap analysis, not your ceiling for improvement.
Equipment Availability Rate
92–95%
96–99%
Top quartile operators achieve 96%+ through condition-based maintenance, redundant spare parts, and technician cross-training. Bottom quartile: 85–91%, driven by reactive maintenance culture.
Mean Time Between Failures (MTBF)
800–1,200 hrs
1,500–2,100 hrs
Primary drilling pumps: median 1,000 hrs. Service trucks: median 1,800 hrs. Top quartile uses vibration + oil analysis to extend MTBF 25–40%. Reactive operators: 600–800 hrs (failures dominate over planned replacements).
Fleet Utilization Rate
68–78%
80–88%
Reflects actual billable hours vs available hours. Drilling rigs: 72–82% (seasonal variation, weather dependent). Service fleets: 65–75% (dispatch efficiency dependent). Top operators: sophisticated scheduling algorithms, 5–10% improvement.
Planned vs Emergency Maintenance Ratio
60:40 (planned:emergency)
75:25 or better
Reactive fleets: 40:60 (majority emergency driven). Top quartile: 80:20, enabled by condition monitoring and predictive systems. Each 10% shift toward planned maintenance saves 8–12% in total maintenance cost.
Maintenance Cost per Operating Hour
$180–$240
$120–$160
Varies by equipment type: drilling pumps $200–$280, service trucks $120–$180. Top quartile: 30–40% lower through prevention focus. Includes parts, labour, diagnostics, emergency response overhead.
First-Time Fix Rate
68–74%
82–89%
Percentage of maintenance jobs completed without requiring a return visit. Low rates indicate inadequate diagnostics, wrong parts ordered, or insufficient technician training. Top quartile: diagnostic apps, expert systems, comprehensive training.
LTIF (Lost Time Injury Frequency)
1.8–2.4 per 200K hrs worked
0.8–1.2 per 200K hrs worked
Top quartile: structured HSE programs, near-miss reporting culture, equipment guarding investment, driver behavior monitoring. Bottom quartile: 3.0–4.5, driven by reactive culture and inadequate training.
Fuel Cost per Kilometre
$0.82–$0.96
$0.68–$0.78
Service fleets with driver behavior coaching achieve 15–22% improvement. Includes fuel price variation ($/litre), vehicle type efficiency, terrain, and driving style. Top quartile: systematic idle reduction, driver training, route optimization.
Vehicle Incident Rate
4.2–5.8 per 100K km
1.8–2.6 per 100K km
Includes all reportable incidents: collisions, near-misses, equipment damage. Top quartile: real-time driver feedback, route hazard training, vehicle condition monitoring. Bottom quartile: 6.0–8.2, driven by uncontrolled driving behavior.
Benchmark Your Fleet Against Industry Standards
FleetRabbit's benchmarking platform compares your fleet's safety, utilization, and downtime KPIs against industry medians — identifying performance gaps and quantifying the ROI of prioritized improvements. Book a demo to see your fleet's benchmark analysis.
KPI Tracking in Practice: From Data Collection to Executive Insight
Telematics & Fleet Management Systems
GPS location, vehicle engine hours, idle time, fuel consumption, service vehicle dispatch history. Primary source for utilization KPIs (availability, utilization rate, billable hours).
Maintenance Management Systems
Work order history, component failure dates, replacement dates, time-to-repair, technician assignments. Primary source for downtime KPIs (MTBF, availability, first-time fix rate, maintenance cost).
Incident & HSE Reporting Systems
Accident reports, near-miss logs, safety audit results, driver behavior incidents, inspection findings. Primary source for safety KPIs (LTIF, TRIR, incident rate, compliance rate).
Financial & Accounting Systems
Fuel costs, maintenance spend, labour allocations, capital equipment investment, production revenue. Primary source for cost-per-unit KPIs and ROI calculations.
Condition Monitoring Systems
Oil analysis results, vibration monitoring data, thermal imaging, equipment telemetry. Secondary source for MTBF prediction, failure prevention, planned maintenance optimization.
Week 1: Data Aggregation
Systems automated pull data from telematics, maintenance, HSE, and finance systems. Raw data compiled: equipment hours, work orders, incidents, cost allocations. No manual data entry — automated extracts reduce errors.
Week 2: KPI Calculation
Automated calculations: Equipment availability = (total hours – downtime hours) / total hours. MTBF = total operating hours / number of failures. Maintenance cost = total costs / operating hours. Benchmarking: compare to industry medians, identify variances.
Week 3: Trend Analysis
Chart month-over-month KPI movement: is availability improving or declining? Are safety metrics stable or deteriorating? Identify emerging trends before they become crises. Three-month trending highlights systemic issues vs normal variation.
Week 4: Executive Reporting
Automated executive summary delivered to operations director, safety lead, and CFO: KPI performance, benchmark gaps, trend alerts, recommended interventions prioritized by ROI. One-page executive view, detailed analysis available on demand.
Real-World Case: KPI Benchmarking Identifies $2.1M Improvement Opportunity
Operator: 28-rig drilling fleet, central Canada, established independent operator, managed internal fleet maintenance.
Equipment Availability
Current: 89%
Median: 93%
Gap: -4% (3 unplanned downtime days per rig per month)
Impact: 28 rigs × 3 days × $85K daily production loss = $7.14M annual impact
Opportunity: Close 50% of gap = $1.78M recovered annually by improving maintenance planning
Planned vs Emergency Maintenance Ratio
Current: 48:52 (48% planned)
Median: 62:38 (62% planned)
Gap: 14 percentage point shortfall (reactive culture)
Emergency maintenance costs 3.2× planned: $280/hr vs $85/hr = $195/hr premium × 8,000 annual emergency hrs = $1.56M excess cost
Opportunity: Shift 30% of emergency work to planned = $468K annual savings via condition monitoring
Fuel Cost per Kilometre
Current: $0.94/km (service fleet)
Median: $0.82/km
Gap: $0.12/km (+14.6% vs median)
Service fleet operates 850K km/year: $0.12 × 850K = $102K annual overspend
Opportunity: Driver behavior coaching + idle reduction = 8–12% improvement = $68K–$102K recovered
First-Time Fix Rate
Current: 62%
Median: 71%
Gap: -9 percentage points (inadequate diagnostics, staff skill gaps)
Repeat visits: 9% × 2,400 annual jobs = 216 repeat visits × $3,200 cost = $691K annual excess cost
Opportunity: Technician training + diagnostic tools = improve to 73% = $380K savings
Aggregated Opportunity: $1.78M (availability) + $0.468M (maintenance planning) + $0.085M (fuel) + $0.38M (first-time fix) = $2.71M potential annual improvement identified through KPI benchmarking analysis. Operator prioritized: (1) condition monitoring deployment ($320K investment, 18-month payback), (2) technician cross-training ($45K investment, 4-month payback), (3) driver behavior program ($52K investment, 8-month payback). Total 3-year investment: $417K. Realized savings: $1.2M in year 1, $2.1M in year 2–3 run rate.
How FleetRabbit Enables KPI Excellence: Benchmarking Platform Features
FAQ: KPI Benchmarking for Oil and Gas Fleet Managers
QHow much should we budget for achieving top-quartile KPI performance?
Typical investment: 2–4% of annual fleet operating budget. For 28-rig fleet at $45M annual operating cost: $900K–$1.8M investment in condition monitoring, technician training, driver behavior systems, and diagnostic tools. Payback: 18–24 months from cost savings + revenue protection. This is lower-risk than most capital projects because ROI is proven by industry benchmarks.
QDo KPI benchmarks differ for oilsands operations vs conventional drilling?
Significantly. Oilsands equipment operates in harsher conditions (cold, sand ingress, higher utilization rates). Benchmarks: availability 88–92% (vs 92–95% conventional), MTBF 600–900 hrs (vs 800–1,200 conventional), maintenance cost $240–$320/hr (vs $180–$240 conventional). FleetRabbit's benchmarking system segments by duty cycle to ensure fair comparison.
Discuss your specific operational context in a demo.
QWhat if our fleet includes contractor and owned equipment — how do we benchmark fairly?
Create separate KPI baskets for owned vs contractor equipment. Compare owned equipment against owned-fleet industry benchmarks. Compare contractor performance against contractor benchmarks (typically wider variance). Track separately in executive reporting so improvement initiatives can be targeted to the right cost center.
QHow quickly do we see improvement after addressing identified KPI gaps?
Depends on initiative type. Driver behavior coaching: 4–8 weeks for measurable fuel and incident reduction. Technician training: 8–12 weeks for first-time fix rate improvement. Condition monitoring deployment: 12–16 weeks to see MTBF and availability improvement (requires 2–3 failure-prediction cycles to prove value). Safety culture changes: 6–12 months to see sustainable LTIF improvement.
QCan we use KPI benchmarks in contract negotiations with customers?
Yes, powerfully. If you can document top-quartile availability performance backed by KPI data, you can support premium pricing. "Our fleet achieves 96% availability vs industry median 93% — we deliver 3 extra revenue days per rig annually at customer's cost risk." Benchmark data is credible evidence in customer discussions and contract renewals.
Turn Performance Data into Competitive Advantage
KPI benchmarking identifies performance gaps that represent millions of dollars in hidden opportunity costs. FleetRabbit automates KPI calculation, benchmarking analysis, and executive reporting — transforming data into actionable insight every month.
Equipment Availability Benchmarking
Safety KPI Tracking
Maintenance Cost Analysis
ROI-Prioritized Improvement Plans
April 13, 2026
By David
All Posts