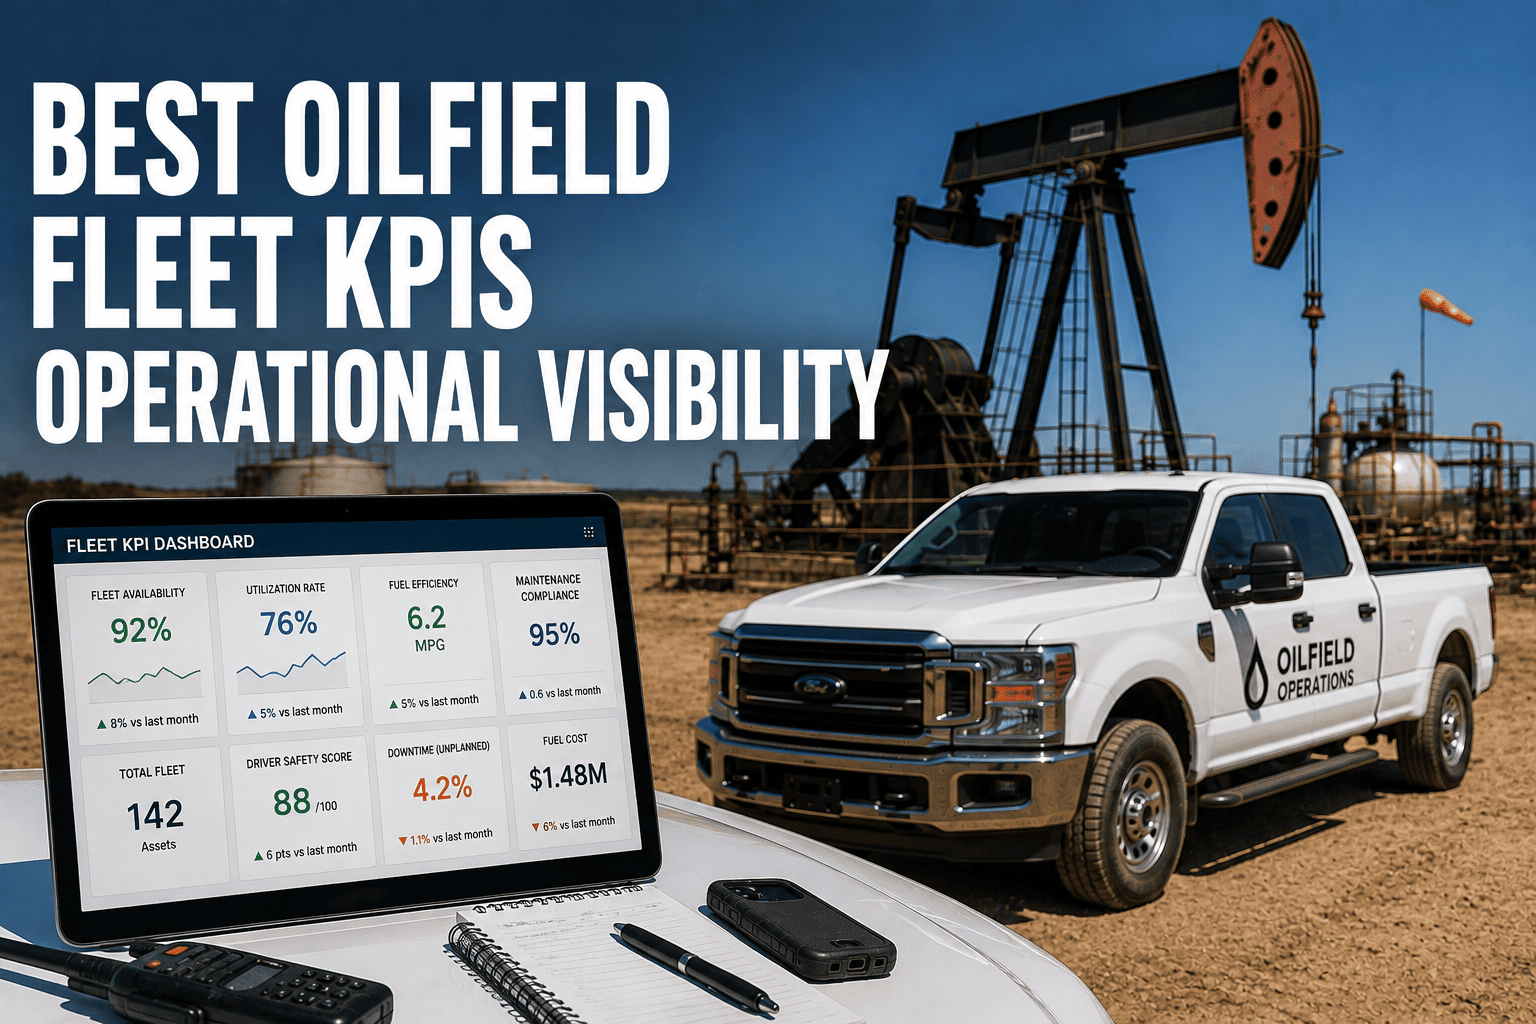
You cannot manage what you cannot measure, and in the oilfield, most fleet managers are flying blind. Decisions about replacements, staffing, and maintenance get made on gut feel because the data lives scattered across paper logs, spreadsheets, and disconnected systems. Tracking the right key performance indicators transforms fleet management from guesswork into strategy. The best oilfield fleet KPIs reveal availability, utilization, cost per hour, maintenance performance, and safety in a single operational view. FleetRabbit brings all of these critical fleet metrics into one dashboard. You can sign up for FleetRabbit to start tracking your KPIs, or book a demo to see the platform.
Over 65 percent of oilfield fleet managers lack real-time visibility into their core performance metrics. Fleets tracking the right KPIs catch cost overruns 3 to 4 months earlier and reduce total operating costs by 10 to 15 percent. The five essential KPI categories are availability, utilization, cost per hour, maintenance performance, and safety compliance.
Why Operational Visibility Depends on KPIs
Operational visibility is the difference between a fleet that improves each quarter and one that repeats the same mistakes. KPIs convert the raw chaos of daily operations into signals a manager can act on. When availability drops, you know before a truck misses a job. When cost per hour creeps up on one asset class, you catch the lemon before it drains the budget. Without these signals, every problem announces itself through its consequences: missed contracts, blown budgets, and roadside failures. With them, problems announce themselves as numbers on a dashboard, weeks before they cost real money.
The Difference Between Data and KPIs
Data and KPIs are not the same thing, and confusing them is why so many fleets drown in information while starving for insight. Data is raw: every fuel transaction, every work order, every engine hour. KPIs are data converted into decision-ready metrics: cost per hour, PM compliance rate, mean time between failures. A fleet can have terabytes of data and zero visibility if no one transforms it into the handful of numbers that matter. The goal is not more data. The goal is fewer, better numbers that a manager can check in five minutes and know exactly how the fleet is performing.
The Five KPI Categories Every Oilfield Fleet Needs
The five KPI categories every oilfield fleet needs form a complete picture of operational health. Availability metrics tell you if trucks are ready to work. Utilization metrics tell you if the trucks you own are actually earning. Cost metrics tell you what each hour of operation truly costs. Maintenance metrics tell you if your shop is proactive or reactive. Safety metrics tell you if compliance risks are building. A dashboard covering these five categories answers nearly every strategic question a fleet manager faces, from replacement timing to budget defense. To build this visibility, you can sign up for FleetRabbit to start tracking your KPIs, or book a demo to see the platform.
FleetRabbit automatically calculates availability, cost per hour, utilization, maintenance performance, and safety KPIs from your live fleet data. Stop compiling spreadsheets and start making decisions. Start your free trial today.
The Essential Oilfield Fleet KPIs Explained
Not all KPIs deserve a place on your dashboard. The essential oilfield fleet KPIs are the ones that connect directly to money, uptime, and compliance. Each metric in the table below answers a specific operational question, and together they give a manager total visibility into fleet performance. Tracking them in real time rather than in monthly reports is what separates reactive fleets from strategic ones.
| KPI | What It Measures | Target Benchmark | Decision It Drives |
|---|---|---|---|
| Fleet Availability | Percent of scheduled hours trucks are operational | 85 to 95 percent by asset class | Whether to add assets or improve maintenance |
| Utilization Rate | Engine hours versus available operating hours | 60 to 75 percent for heavy assets | Right-sizing the fleet and swing buffers |
| Cost Per Hour | Total operating cost divided by engine hours | Trend stable or declining per asset | Replacing lemons and defending budgets |
| PM Compliance | Percentage of PMs completed on schedule | 95 percent or higher | Whether maintenance scheduling is working |
| MTBF | Mean time between unplanned failures | Improving quarter over quarter | Effectiveness of the maintenance program |
| HOS Violation Rate | Violations per driver per month | Approaching zero | Dispatch planning and driver coaching needs |
| DVIR Completion | Percentage of required inspections completed | 95 percent or higher | Compliance risk and inspection enforcement |
Turning KPIs Into Action
Tracking KPIs without acting on them is just expensive reporting. The value emerges when each metric has an owner, a target, and a response plan. When availability dips below target, the maintenance lead knows to investigate the failing asset class. When cost per hour spikes on a specific truck, the fleet manager knows to run a replace-versus-repair analysis. The best practice is a weekly KPI review, fifteen minutes with the dashboard, where each metric is checked against target and deviations trigger a named action with a deadline. This rhythm converts visibility into continuous improvement.
Setting Realistic Targets Per Asset Class
Setting realistic targets per asset class is critical because blanket targets create false alarms and false confidence. A heavy hauler working lease roads should not carry the same availability target as a light-duty pickup running highway routes. Aging assets deserve lower targets that reflect their maintenance reality, not the number that looks good in a report. The right approach is baselining each asset class from your own historical data, then setting improvement targets of 3 to 5 percent per quarter. FleetRabbit calculates these baselines automatically from your live data, so targets reflect how your fleet actually performs rather than an industry average that fits no one.
Catching Cost Spikes Before They Compound
Catching cost spikes before they compound is where real-time KPI tracking pays its biggest dividends. A truck whose cost per hour rises 20 percent in a month is telling you something: a failing component, a new operating pattern, or an emerging lemon. In a monthly reporting cycle, that signal sits hidden for weeks while the costs accumulate. On a live dashboard, the spike is visible the day it forms, and the investigation starts while the fix is still cheap. Fleets that monitor cost KPIs in real time typically catch developing problems two to three months earlier than fleets relying on lagging reports. To catch your cost spikes early, you can sign up for FleetRabbit to start tracking your KPIs, or book a demo to see the platform.
How FleetRabbit Unifies Fleet Metrics
FleetRabbit is built to calculate the KPIs that matter without asking managers to become analysts. The platform automatically pulls telematics data, work orders, fuel transactions, and compliance records into a single system, then computes availability, utilization, cost per hour, and maintenance performance continuously. There is no spreadsheet compilation, no waiting for month-end, and no debate about whose numbers are right. The dashboard shows one version of the truth, updated live, drilled down to the asset, driver, and site level. This unified view is what operational visibility actually looks like in practice.
Executive and Shop Views From One Source
Executive and shop views from one source eliminate the data disputes that plague fleet reporting. The executive dashboard shows trend lines, cost summaries, and exception alerts for leadership review. The maintenance view shows PM compliance, MTBF, and open work orders for the shop team. Both views draw from the same underlying data, so the CFO and the shop foreman never argue about whose numbers are correct. When everyone trusts the same metrics, budget conversations shift from defending estimates to discussing strategy, and maintenance planning shifts from firefighting to forecasting.
Benchmarking Sites and Asset Classes
Benchmarking sites and asset classes is the analytical payoff of unified KPI tracking. FleetRabbit compares availability, cost per hour, and utilization across every yard and asset class in the operation. Managers instantly see which sites run efficiently and which are outliers dragging the average. The same comparison applies to asset classes, revealing that vacuum trucks cost 40 percent more per hour than the fleet average, or that one yard's heavy haulers achieve significantly better MTBF than another's. These benchmarks turn abstract performance questions into specific, actionable comparisons that drive standardization and cost reduction across the entire operation.
Key Takeaways for KPI Tracking
Tracking the right oilfield fleet KPIs is the foundation of operational visibility and strategic fleet management. Fleets that rely on scattered data and monthly reports discover problems only after the money is gone. The five essential categories, availability, utilization, cost, maintenance, and safety, cover every decision a fleet manager faces, from replacement timing to compliance defense.
FleetRabbit calculates all of these KPIs automatically from live fleet data, presenting them in a single dashboard with drill-down to asset, driver, and site level. Fleets using unified KPI tracking typically cut operating costs 10 to 15 percent by catching cost spikes early, right-sizing their fleets, and defending budgets with hard numbers instead of estimates.
The path forward is clear. Ask yourself whether you could state your fleet's availability, cost per hour, and PM compliance right now, from memory, backed by data. If the answer requires a week of spreadsheet work, you are managing blind. Fleet managers who track KPIs systematically protect their profitability and operational reliability. You can sign up for FleetRabbit to start tracking your KPIs, or book a demo to see the platform.
Frequently Asked Questions About Fleet KPIs
Every day without KPI visibility is a day of unmeasured cost, missed utilization, and hidden risk. FleetRabbit brings availability, cost, maintenance, and safety metrics into one live dashboard your whole team can trust. See a 15 percent cost reduction within months. Start your free trial today with no credit card required.







