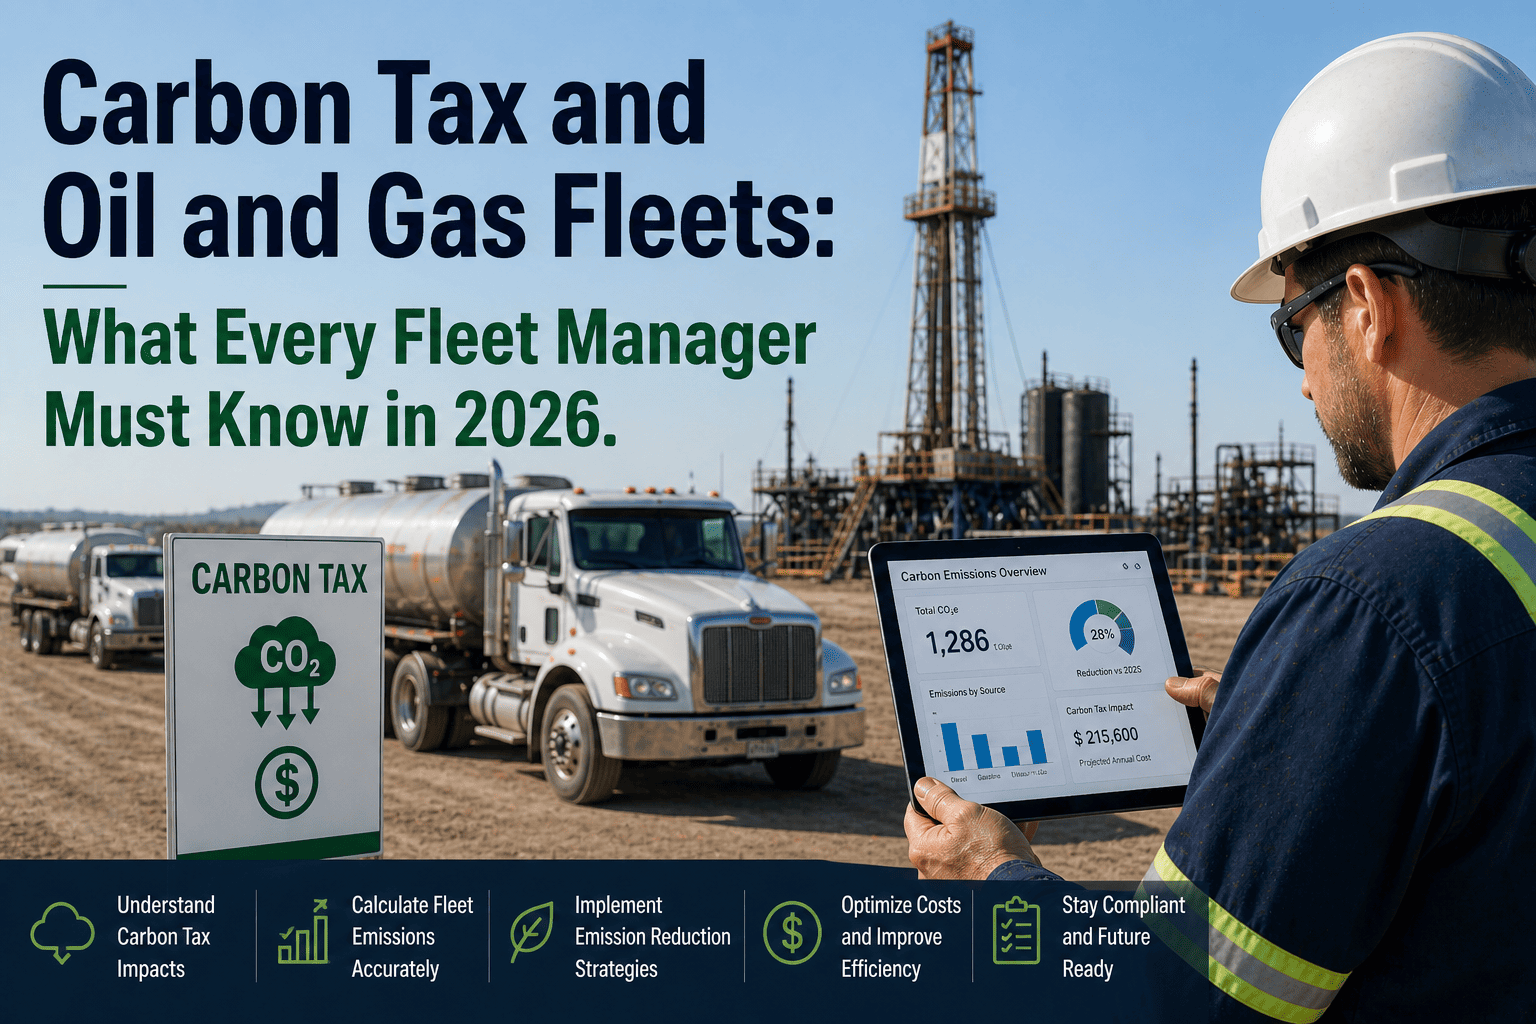
Carbon pricing mechanisms represent existential threat to oilfield operating economics where fleet emissions constitute 18-35% of total operational carbon footprint — translating mandatory carbon tax exposure into $42-$87 per tonne liability that directly impacts per-barrel lifting costs, service contractor margins, and capital project economics in jurisdictions implementing comprehensive carbon pricing frameworks including Canada's federal carbon tax ($80/tonne in 2024, escalating to $170/tonne by 2030), California's cap-and-trade system, and emerging state-level programs across Colorado, New Mexico, and Pennsylvania targeting upstream oil and gas emissions. A Bakken operator managing 180-vehicle fleet supporting drilling and completion operations calculated $840,000 annual carbon tax liability under current pricing with projected escalation to $2.1 million by 2030 absent emissions reduction interventions — cost burden equivalent to 15-22% of total fleet operating budget that cannot be absorbed through efficiency gains alone, forcing strategic decision between aggressive decarbonization investment or accepting margin compression as carbon costs compound annually at regulatory-mandated escalation rates. Yet despite mounting financial exposure, 71% of oilfield fleet operators lack comprehensive emissions measurement systems, idle time tracking infrastructure, or route optimization capabilities required to quantify carbon footprint, identify reduction opportunities, and demonstrate compliance with evolving reporting mandates that will transition from voluntary disclosure to mandatory regulatory requirements over 18-36 month horizon. This analysis explores carbon pricing impact on oilfield fleet economics, emissions reduction strategies delivering measurable tax liability reduction, and why FleetRabbit's integrated telematics platform provides the emissions tracking, idle reduction enforcement, and route optimization intelligence required to transform carbon tax from uncontrollable cost escalation into manageable operational variable through data-driven fleet decarbonization. Schedule carbon compliance strategy session to quantify your fleet's emissions exposure and reduction roadmap.
CARBON PRICING REALITY 2026
How Carbon Tax Transforms From Future Concern to Immediate Profit Margin Threat
Carbon pricing regimes no longer represent distant regulatory possibility discussed in sustainability reports — they constitute current operational reality imposing direct cost burden on every gallon of diesel consumed, every hour of engine idle time, and every inefficient route mile traveled by oilfield fleet operations across expanding jurisdictions with escalating per-tonne carbon prices that compound fleet operating costs by 8-15% annually without offsetting operational improvements.
Current Federal Carbon Tax (Canada)
$80/tonne
Projected 2030 Rate
$170/tonne
Fleet Carbon Cost Escalation
112% Increase
180-vehicle oilfield fleet
Average 18,000 miles annually per vehicle
Fleet average 9.2 MPG
Annual diesel consumption: 351,304 gallons
CO2 emissions at 10.21 kg per gallon
3,587 tonnes
Carbon tax liability at $80/tonne (2024)
$287,000
Projected liability at $170/tonne (2030)
$610,000
Six-Year Cost Escalation
$323,000 Additional Annual Burden
Pricing Mechanism
Federal carbon tax applied to fossil fuel combustion with backstop provisions ensuring minimum national carbon price across all provinces and territories. Provinces may implement equivalent provincial systems meeting federal stringency requirements.
2024 Rate
$80/tonne CO2e
2030 Target
$170/tonne CO2e
Annual escalation: $15/tonne through 2030
Coverage Scope
All diesel and gasoline combustion for fleet vehicles
Natural gas consumption for equipment operation and facility heating
Propane and other hydrocarbon fuels used in oilfield operations
Fleet Impact Assessment
Diesel carbon tax component adds $0.178 per liter ($0.674 per gallon) at current $80/tonne rate, escalating to $0.378 per liter ($1.43 per gallon) by 2030. For fleet consuming 1.3 million liters annually, current tax burden equals $231,000 with projected 2030 liability of $491,000.
Pricing Mechanism
Market-based cap-and-trade system requiring covered entities to obtain carbon allowances for emissions. Transportation fuel distributors must surrender allowances covering combustion emissions from fuels sold, with costs passed through fuel pricing to end consumers including fleet operators.
Current Allowance Price
$32-$38/tonne range
Price Floor Escalation
5% annually + inflation
Market prices fluctuate based on allowance supply-demand dynamics
Coverage Scope
Embedded cost in diesel and gasoline pricing affecting all fleet fuel purchases
Direct compliance obligations for large fleet operators exceeding 25,000 tonnes CO2e annually
Low Carbon Fuel Standard creating additional compliance costs beyond cap-and-trade
Fleet Impact Assessment
Combined cap-and-trade and Low Carbon Fuel Standard costs add estimated $0.40-$0.55 per gallon to diesel pricing. California-based oilfield operations face dual compliance burden from carbon pricing plus strict emissions reporting and reduction mandates under state climate regulations.
Pricing Mechanism
Sector-specific emissions reduction mandates with potential carbon fee implementation under consideration by state legislature. Current framework focuses on regulatory emissions limits for oil and gas operations with compliance costs effectively functioning as implicit carbon price through required mitigation investments.
Current Status
Regulatory mandates, no explicit carbon tax
Potential Carbon Fee
Under legislative consideration
Emissions reduction targets: 26% by 2025, 50% by 2030 from 2005 baseline
Regulatory Obligations
Mandatory emissions reporting for oil and gas operations exceeding thresholds
Leak detection and repair requirements imposing compliance costs
Potential future carbon fee on fossil fuel consumption including fleet diesel
Fleet Impact Assessment
While explicit carbon pricing not yet implemented, regulatory compliance costs function as implicit carbon price estimated at $15-$25 per tonne equivalent. Fleet operators should prepare for potential carbon fee implementation within 24-36 month timeframe based on legislative trajectory.
Pricing Mechanism
State climate strategy under development with carbon pricing under evaluation as potential policy tool. Current focus on methane emissions reduction from oil and gas operations with fleet emissions included in comprehensive greenhouse gas inventory and reduction planning.
Current Status
Policy development phase
Timeline
Implementation uncertain, 2027-2029 potential
Emissions reduction goals: 45% by 2030 from 2005 baseline
Anticipated Coverage
Comprehensive greenhouse gas emissions from oil and gas sector including fleet operations
Potential carbon fee or cap-and-trade system modeled on California program
Enhanced emissions reporting and verification requirements preceding carbon pricing implementation
Fleet Impact Assessment
Proactive fleet operators in New Mexico should establish emissions baseline measurement and reduction programs in anticipation of future carbon pricing implementation, positioning to demonstrate early action and potentially qualify for compliance credits or reduced obligations under eventual regulatory framework.
Carbon pricing expansion across North American oil and gas regions creates urgent requirement for comprehensive fleet emissions tracking and reduction capabilities. FleetRabbit's integrated telematics platform provides the idle time monitoring, route optimization, and emissions quantification tools required to measure carbon footprint, identify reduction opportunities, and demonstrate regulatory compliance. Deploy emissions tracking across your fleet today.
01
12-18% Emissions Reduction
Aggressive Idle Time Reduction Through Real-Time Monitoring and Enforcement
Emissions Source
Excessive engine idling represents single largest controllable emissions source in oilfield fleet operations where vehicles idle average 35-48% of engine hours for cab climate control, auxiliary power, and operational standby requirements. At 0.8 gallons per hour idle fuel consumption, 180-vehicle fleet idling 2.5 hours daily wastes 131,400 gallons annually generating 1,340 tonnes CO2e and $107,000 carbon tax liability at $80/tonne pricing.
FleetRabbit Implementation
Real-time idle monitoring through GPS telematics tracks engine-on time versus vehicle movement identifying excessive idle periods and enabling automated driver alerts when idle time exceeds policy thresholds. Dashboard analytics reveal idle time by vehicle, driver, and location enabling targeted coaching for high-idle operators and identification of operational scenarios requiring alternative solutions like auxiliary power units or improved work scheduling.
Automated Idle Alerts
In-cab notifications trigger when vehicle idles 5+ minutes without movement, prompting driver shutdown and reducing unnecessary idling from inattention or habit
Idle Time Leaderboards
Gamification through driver rankings and recognition for lowest idle percentages creates positive peer pressure reducing fleet-wide idle time through behavioral modification
Exception Management
System allows legitimate idle time exceptions for hydraulic operations, PTO usage, and extreme weather while flagging policy violations requiring supervisory review
Idle time reduction
40-55% decrease
Annual fuel savings
52,000-72,000 gallons
Emissions reduction
530-735 tonnes CO2e
Carbon tax savings at $80/tonne
$42,000-$59,000 annually
02
8-14% Emissions Reduction
Route Optimization Eliminating Unnecessary Miles and Fuel Consumption
Emissions Source
Inefficient routing and dispatch practices result in excessive deadhead miles, duplicative trips, and suboptimal vehicle-to-task assignments wasting 12-20% of total miles driven without productive output. Analysis of 180-vehicle fleet revealed 8-15 unnecessary miles per vehicle daily from poor route planning, totaling 518,000-972,000 excess miles annually consuming 56,000-106,000 gallons and generating 570-1,080 tonnes avoidable CO2e emissions.
FleetRabbit Implementation
GPS tracking combined with dispatch optimization algorithms analyzes historical route data, identifies efficiency opportunities, and provides route recommendations minimizing total fleet miles while maintaining service levels. Platform calculates optimal vehicle assignments considering current location, fuel level, maintenance status, and task requirements preventing assignment of distant vehicles when closer alternatives available.
Historical Route Analysis
Platform identifies repeatedly driven inefficient routes and suggests alternatives reducing mileage by 8-18% through highway versus surface street selection and traffic pattern avoidance
Multi-Stop Optimization
Algorithm sequences multiple service locations minimizing total distance traveled versus ad-hoc routing determined by driver judgment or arrival order of work requests
Proximity-Based Dispatch
Real-time vehicle location enables assignment of nearest appropriate asset to service requests rather than default assignment to specific crews regardless of position
Miles reduction
10-16% decrease
Annual fuel savings
35,000-56,000 gallons
Emissions reduction
357-571 tonnes CO2e
Carbon tax savings at $80/tonne
$29,000-$46,000 annually
03
6-11% Emissions Reduction
Driver Behavior Modification Targeting Aggressive Acceleration and Speeding
Emissions Source
Aggressive driving behaviors including harsh acceleration, excessive speeding, and rapid deceleration reduce fuel efficiency 15-25% compared to smooth driving techniques while accelerating vehicle wear and safety incident risk. Telematics analysis across oilfield fleets reveals 30-45% of drivers exhibit consistently aggressive driving patterns contributing disproportionately to fuel consumption and emissions despite representing minority of driver population.
FleetRabbit Implementation
Accelerometer-based driving behavior monitoring scores each driver across multiple dimensions including harsh braking, rapid acceleration, cornering speed, and posted speed limit compliance. Real-time in-cab coaching provides immediate feedback when aggressive maneuvers detected while retrospective scorecards enable targeted training for consistently poor performers and recognition programs rewarding smooth driving excellence.
In-Cab Coaching Alerts
Audible and visual alerts during harsh braking, rapid acceleration, or speeding events provide immediate behavior correction in moment rather than delayed feedback through weekly reports
Driver Scorecards
Comprehensive scoring across safety, efficiency, and compliance metrics enables supervisor coaching conversations supported by objective data rather than subjective observation
Recognition Programs
Monthly recognition and incentives for top-scoring drivers creates positive motivation for behavior improvement while establishing peer benchmarks demonstrating achievable performance standards
Fuel efficiency improvement
8-12% increase
Annual fuel savings
28,000-42,000 gallons
Emissions reduction
286-429 tonnes CO2e
Carbon tax savings at $80/tonne
$23,000-$34,000 annually
04
4-8% Emissions Reduction
Predictive Maintenance Preventing Efficiency-Degrading Mechanical Issues
Emissions Source
Mechanical deterioration from deferred maintenance reduces fuel efficiency through multiple pathways including dirty air filters restricting intake flow, underinflated tires increasing rolling resistance, worn fuel injectors causing incomplete combustion, and transmission issues preventing optimal gear selection. Fleets operating reactive maintenance approaches experience 6-12% fuel efficiency degradation versus well-maintained vehicles in optimal mechanical condition.
FleetRabbit Implementation
Predictive maintenance AI identifies developing mechanical issues affecting fuel efficiency through fault code analysis, performance metric trending, and anomaly detection algorithms flagging vehicles experiencing MPG degradation for diagnostic investigation. Automated maintenance scheduling ensures preventive services performed on-time preventing efficiency losses from overdue air filter replacements, tire rotations, and fluid changes.
Fuel Efficiency Trending
Platform tracks MPG by vehicle identifying gradual degradation patterns indicating developing mechanical issues requiring diagnostic attention before efficiency loss becomes severe
Maintenance Interval Enforcement
Automated scheduling ensures filters, fluids, and efficiency-critical components serviced at manufacturer-recommended intervals preventing performance degradation from deferred maintenance
Tire Pressure Monitoring
Integration with tire pressure monitoring systems alerts to underinflation conditions reducing fuel economy 0.3% per PSI below optimal pressure — seemingly small impact compounding to substantial waste across large fleets
Fuel efficiency recovery
5-9% improvement
Annual fuel savings
17,500-31,600 gallons
Emissions reduction
179-323 tonnes CO2e
Carbon tax savings at $80/tonne
$14,000-$26,000 annually
05
3-6% Emissions Reduction
Right-Sizing Fleet Composition and Strategic Electrification
Emissions Source
Oversized vehicles assigned to light-duty applications consume 20-35% more fuel than appropriately-sized alternatives while underutilized specialty equipment generates emissions during positioning and standby periods without productive output. Additionally, 100% diesel fleet composition represents missed opportunity for zero-emission vehicle deployment in suitable applications where electric vehicles deliver operational cost advantages plus complete carbon tax elimination for electric miles.
FleetRabbit Implementation
Utilization analysis reveals vehicle-to-task mismatches where heavy-duty trucks assigned to supervisor roles consume excessive fuel versus lighter alternatives, identifies underutilized assets generating emissions without commensurate value, and pinpoints duty cycles suitable for electric vehicle deployment through range requirement analysis and charging infrastructure feasibility assessment.
Duty Cycle Analysis
Platform categorizes vehicle usage by duty cycle intensity identifying light-duty applications currently served by heavy-duty vehicles where downsizing reduces emissions and operating costs
EV Suitability Scoring
Analysis of daily range requirements, route patterns, and charging opportunity windows identifies specific vehicles and routes suitable for electric vehicle deployment maximizing carbon elimination potential
Total Cost Comparison
TCO modeling compares diesel versus electric alternatives accounting for fuel savings, maintenance reduction, carbon tax avoidance, and available incentives providing quantitative business case for electrification investments
Fleet composition optimization
12-18 vehicle right-sizing opportunities
Annual fuel savings
10,500-21,000 gallons
Emissions reduction
107-214 tonnes CO2e
Carbon tax savings at $80/tonne
$9,000-$17,000 annually
Combined Emissions Reduction
28-42%
Annual Carbon Tax Savings (180-vehicle fleet)
$117,000-$182,000
2030 Projected Savings at $170/tonne
$248,000-$387,000
Implementation of all five strategies delivers compounding benefits exceeding sum of individual interventions through synergistic effects where route optimization reduces idle time opportunities, driver coaching improves maintenance-dependent efficiency, and right-sized vehicles enable more effective electrification transitions.
CARBON TAX MITIGATION PLATFORM
FleetRabbit Provides Complete Carbon Emissions Tracking and Reduction Intelligence
From real-time idle monitoring and route optimization to driver behavior scoring and predictive maintenance — FleetRabbit integrates all emissions reduction capabilities required to systematically reduce carbon tax liability by 28-42% through data-driven operational interventions rather than relying on unproven offset purchases or capital-intensive electrification programs as sole mitigation strategies.
28-42%
Emissions Reduction Potential
$117K-$182K
Annual Tax Savings (180 Vehicles)
$3/Vehicle
All-Inclusive Monthly Cost
Canadian Federal Requirements
Greenhouse Gas Reporting Program (GHGRP)
Facilities emitting 10,000 tonnes CO2e annually must report emissions to Environment and Climate Change Canada with detailed methodology documentation, third-party verification for facilities exceeding 50,000 tonnes, and standardized reporting templates following federal guidance. Fleet emissions included in facility-level totals requiring granular tracking by vehicle, fuel type, and operational category.
Annual submission deadline: June 1 following reporting year
Third-party verification required for large emitters
Penalties up to $500,000 for non-compliance or false reporting
California Requirements
Mandatory GHG Reporting Regulation
Entities emitting 25,000 tonnes CO2e annually report to California Air Resources Board using detailed calculation methodologies specified in regulation. Fleet operators report diesel consumption by vehicle category with supporting documentation including fuel purchase records, mileage logs, and emissions calculations following approved protocols.
Annual reporting deadline: Varies by facility category
Third-party verification mandatory for all reporting entities
Civil penalties $500-$25,000 per day for violations
Emerging State Requirements
Colorado and New Mexico Developing Programs
States implementing comprehensive climate strategies developing emissions reporting frameworks modeled on federal and California programs but potentially including lower thresholds capturing smaller operators and expanded scope covering indirect emissions from contracted services including third-party fleet operations supporting oil and gas facilities.
Thresholds and timelines under regulatory development
Potential expanded scope to contracted fleet services
Proactive tracking recommended to ensure compliance readiness
Automated Emissions Calculation
Platform calculates fleet CO2e emissions using approved methodologies from fuel consumption data, applying jurisdiction-specific emission factors and reporting protocols eliminating manual spreadsheet calculations prone to errors and audit findings
Audit Trail Documentation
System maintains complete supporting documentation including fuel purchase records, vehicle assignments, mileage logs, and calculation worksheets in format ready for third-party verification or regulatory audit without manual file assembly
Multi-Jurisdiction Reporting
Operators with cross-border or multi-state operations generate jurisdiction-specific reports following each regulatory framework's unique requirements, thresholds, and submission formats from single unified data source
Threshold Monitoring
Platform tracks cumulative emissions against reporting thresholds alerting when approaching levels triggering compliance obligations enabling proactive preparation rather than discovering requirements after exceeding thresholds
CARBON PRICING PROTECTION
Stop Accepting Carbon Tax as Uncontrollable Cost Escalation
FleetRabbit transforms carbon pricing from inevitable margin compression into manageable operational variable through comprehensive emissions tracking, targeted reduction strategies, and automated compliance reporting — enabling oilfield fleet operators to reduce tax liability 28-42% through data-driven interventions while maintaining complete regulatory compliance across expanding jurisdictional requirements.
$248K-$387K
Projected 2030 Annual Savings (180 Vehicles)
5 Strategies
Integrated Reduction Approaches
Automated
Compliance Reporting
$3/Vehicle
Complete Platform Cost
Idle Time Monitoring
Route Optimization
Driver Behavior Scoring
Predictive Maintenance
EV Transition Analysis
Emissions Reporting
May 2, 2026
By David
All Posts