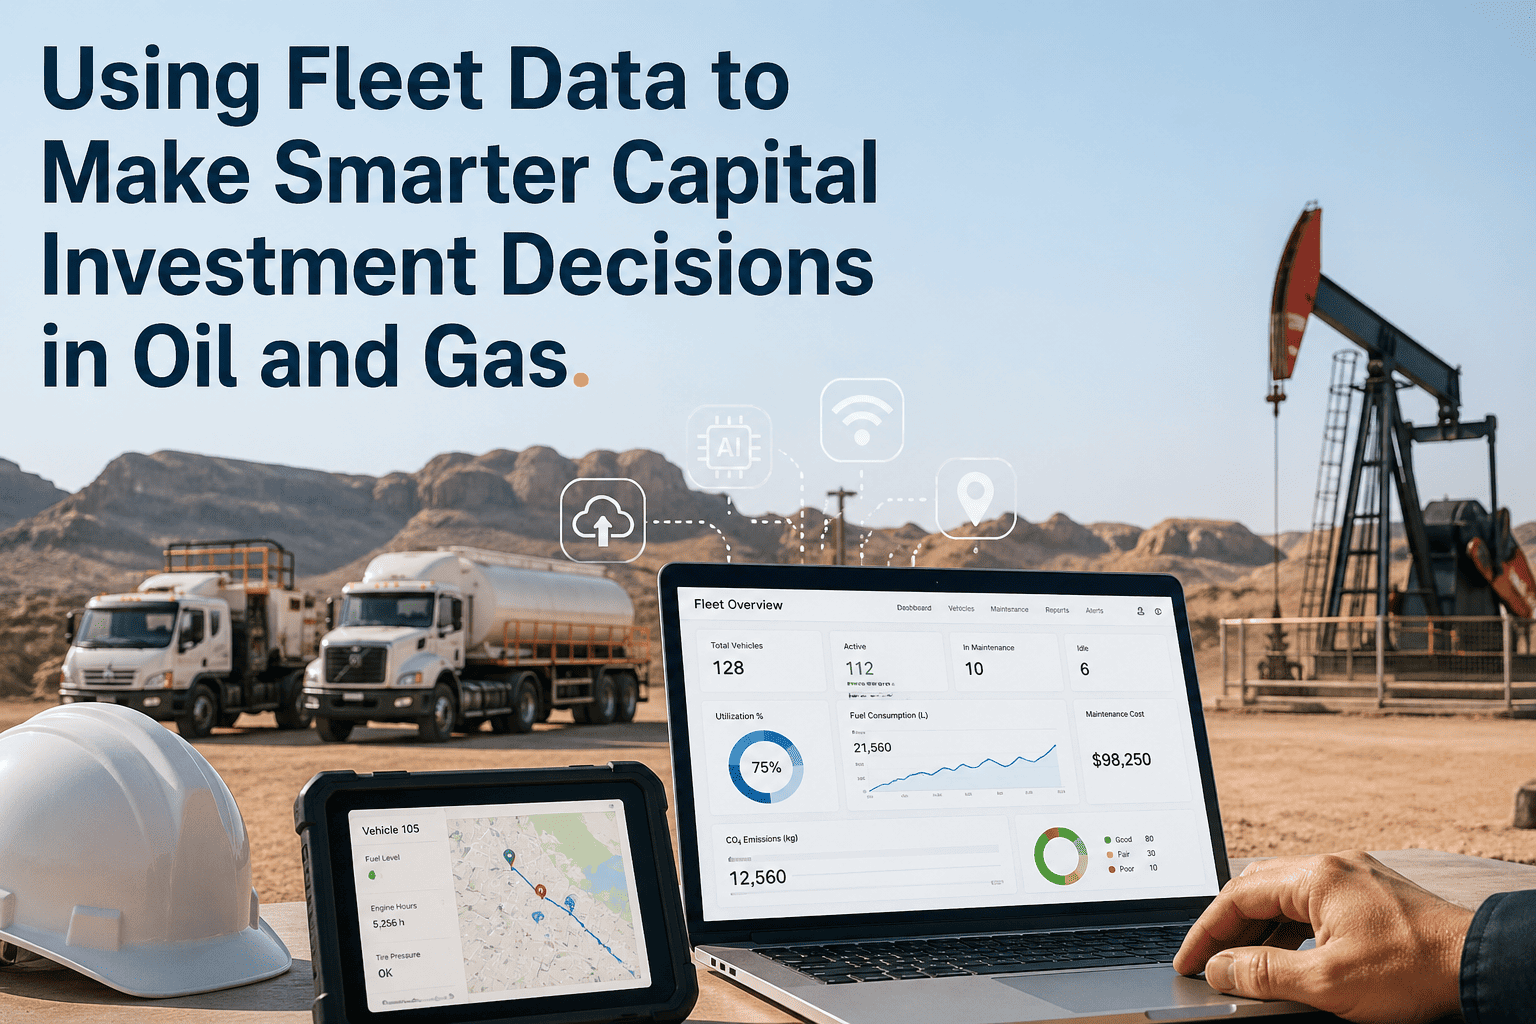
Using Fleet Data to Make Smarter Capital Investment Decisions in Oil and Gas

kioilia-best-oil-gas-fleet-management-software

Fleet capital investment decisions in oil and gas operations traditionally rely on crude heuristics — replacing vehicles at arbitrary mileage thresholds, purchasing equipment based on vendor relationships rather than utilization data, and sizing fleets through guesswork instead of quantitative demand analysis — resulting in systematic capital misallocation where operators simultaneously maintain underutilized assets consuming depreciation and carrying costs while experiencing capacity shortages requiring expensive emergency rentals during peak demand periods. A Permian Basin operator managing 240-vehicle fleet across drilling and production operations transformed capital planning from intuition-driven to data-informed approach through comprehensive fleet analytics deployment, discovering 38% of assets operated below economic utilization thresholds justifying immediate disposition, optimal replacement timing occurred 18-24 months later than traditional age-based policies for vehicles in severe-duty cycles, and fleet could handle 22% additional workload through intelligent dispatch optimization without capital investment — insights generating $4.2 million capital avoidance over three-year planning horizon while improving operational capacity. Yet 74% of oilfield fleet operators still make multi-million dollar capital decisions without accessing comprehensive utilization data, total cost of ownership analytics, or predictive lifecycle modeling that modern fleet management platforms provide as standard capability. This analysis explores how fleet data transforms capital investment decision-making from educated guessing into quantitative optimization, the specific metrics that drive highest-value insights, and why FleetRabbit's integrated analytics architecture delivers superior decision support compared to fragmented legacy approaches relying on spreadsheet compilation from disconnected systems. Schedule capital planning consultation to discover data-driven investment insights for your fleet.

DATA-DRIVEN CAPITAL PLANNING

How Fleet Analytics Transform Capital Investment from Guesswork to Quantitative Optimization

From utilization tracking and lifecycle cost analysis to predictive replacement modeling and capacity planning — discover how comprehensive fleet data eliminates capital waste, optimizes replacement timing, and sizes fleets to actual demand rather than historical precedent or vendor recommendations

$4.2M
Capital Avoidance Over 3 Years
38%
Assets Below Economic Threshold
22%
Capacity Gain Without Investment
STRATEGIC FRAMEWORK

Five Capital Investment Questions Fleet Data Answers Definitively

Effective capital allocation requires answering fundamental questions about asset utilization, lifecycle economics, capacity requirements, replacement timing, and make-model selection — questions impossible to answer accurately without comprehensive operational data spanning vehicle performance, cost history, utilization patterns, and predictive failure modeling across entire fleet population and multi-year time horizons.

QUESTION 1

Which Assets Should Be Disposed Immediately to Eliminate Uneconomic Carrying Costs?

Traditional Approach Without Data
Fleet managers identify disposal candidates through subjective assessment of vehicle condition, driver complaints, and maintenance frequency without quantitative analysis of utilization rates, total cost of ownership, or opportunity cost calculations. Vehicles remain in service because "they still run" despite consuming insurance, depreciation, and garage space while generating minimal productive hours. Result: fleets carry 25-40% excess capacity in underutilized assets preventing capital reallocation to higher-value investments.
Data-Driven Approach with Fleet Analytics
Comprehensive utilization tracking reveals which vehicles operate below economic thresholds where combined carrying costs (depreciation, insurance, registration, garage allocation) exceed operational value generated. Analytics platform calculates utilization percentage, cost per utilized hour, and identifies assets operating fewer than 800 hours annually in typical oilfield duty cycles — threshold where disposition and rental-as-needed approach delivers superior economics compared to ownership.
Utilization Threshold Analysis Vehicles operating under 35% annual utilization cost $8,200-$14,500 more per year to own than rent equivalent capacity on-demand
Carrying Cost Transparency Platform reveals true cost including depreciation, insurance, storage, and opportunity cost of capital tied up in underutilized assets
Disposition Priority Ranking Automated scoring identifies highest-impact disposal candidates based on utilization, age, maintenance cost trends, and replacement market value
Real Implementation Example
240-vehicle fleet analysis identified 38 units operating below 30% utilization with combined annual carrying costs of $680,000 while generating operational value equivalent to $280,000 in rental fees. Immediate disposition of 31 lowest-utilization assets reduced fleet to 209 vehicles, eliminated $420,000 annual carrying costs, and rental coverage for occasional peak demand cost only $85,000 annually — net savings $335,000 per year while maintaining operational capacity.
QUESTION 2

What Is Optimal Replacement Timing for Each Vehicle Class and Duty Cycle?

Traditional Approach Without Data
Replacement policies based on arbitrary age or mileage thresholds applied uniformly across entire fleet regardless of duty cycle, operating environment, or actual condition. Common rules like "replace at 150,000 miles" or "five-year service life" ignore reality that light-duty supervisor trucks in urban operations remain economical far beyond these thresholds while heavy-duty oilfield service trucks in severe environments reach economic replacement point earlier. Result: premature replacement of viable assets and delayed replacement of vehicles consuming excessive maintenance spend.
Data-Driven Approach with Fleet Analytics
Lifecycle cost modeling analyzes total cost of ownership curves for each vehicle class and duty cycle, identifying inflection point where rising maintenance costs, declining reliability, and residual value depreciation make replacement economically optimal. Platform tracks maintenance cost per mile trends, unplanned downtime frequency, and parts availability constraints to forecast when vehicles transition from economical operation to capital trap consuming disproportionate resources.
Severe-Duty Oilfield Service Trucks
Economic replacement occurs at 180,000-220,000 miles or 6-7 years when maintenance costs exceed $0.45 per mile and unplanned downtime reaches 8+ events annually. Traditional 250,000-mile threshold results in final 18 months where maintenance costs equal 60% of replacement vehicle acquisition price.
Light-Duty Supervisor Vehicles
Economic replacement extends to 280,000-320,000 miles or 9-11 years in low-stress highway driving. Premature replacement at industry-standard 150,000 miles discards vehicles with 130,000+ remaining economical miles, wasting $18,000-$28,000 residual value per unit.
Specialized Equipment Haulers
Replacement driven by technological obsolescence and emissions compliance rather than mileage. Vehicles remain mechanically sound past 300,000 miles but regulatory changes, safety standard evolution, and equipment compatibility requirements justify earlier replacement regardless of condition.
QUESTION 3

Should Fleet Be Expanded, Contracted, or Maintained at Current Size?

Traditional Approach Without Data
Fleet sizing decisions based on historical precedent, driver requests for additional vehicles, and reactive response to capacity shortages requiring emergency rentals. Operators maintain fleets sized to peak historical demand without analyzing whether peak represents sustained requirement or temporary spike, resulting in chronic overcapacity during normal operations. Alternatively, fleets remain undersized forcing expensive emergency rentals because decision-makers lack data proving investment justification to executive leadership.
Data-Driven Approach with Fleet Analytics
Utilization analysis reveals actual capacity requirements versus installed capacity, identifying whether operational constraints stem from insufficient vehicles or inefficient deployment. Platform analyzes utilization distribution across fleet, peak demand patterns, and dispatch optimization potential to determine if capacity gaps can be closed through better asset allocation or genuinely require capital investment in additional units.
Capacity Analysis Framework
STEP 1
Calculate fleet-wide utilization percentage and identify variance across vehicle classes
If average utilization under 70% with high variance, capacity exists but poor allocation prevents access
STEP 2
Analyze temporal demand patterns identifying peak periods, seasonal fluctuations, and sustained versus temporary requirements
If peaks are infrequent and temporary, rental strategy superior to capital investment in rarely-used capacity
STEP 3
Model dispatch optimization potential through better vehicle-to-task matching and utilization balancing
Intelligent dispatch typically unlocks 15-25% additional capacity from existing fleet without capital investment
STEP 4
Quantify genuine capacity gap after optimization and rental coverage of temporary peaks
Only sustained demand exceeding optimized capacity plus cost-effective rental justifies expansion capital
QUESTION 4

Which Make and Model Delivers Best Total Cost of Ownership for Each Application?

Traditional Approach Without Data
Vehicle selection based on acquisition price comparison, dealer relationships, brand loyalty, or subjective driver preferences without quantitative analysis of lifecycle costs spanning fuel efficiency, maintenance expenses, reliability, and resale value. Operators choose lowest-acquisition-cost options maximizing initial capital efficiency while unknowingly committing to higher operating expenses that overwhelm purchase price savings within 18-24 months of service.
Data-Driven Approach with Fleet Analytics
Total cost of ownership analysis compares competing makes and models across complete lifecycle including acquisition, fuel, maintenance, insurance, downtime impact, and residual value at disposition. Platform tracks actual costs from existing fleet population enabling evidence-based comparison rather than relying on manufacturer claims or industry averages that may not reflect operator-specific duty cycles and operating environments.
Representative TCO Comparison: Heavy-Duty Service Truck
Vehicle A: Lower Acquisition Cost
Purchase price $48,500
Fuel cost over 200K miles at 11.2 MPG $62,400
Maintenance cost over lifecycle $44,200
Downtime impact (18 events at $8,500 avg) $153,000
Residual value at disposition -$12,800
Total Cost of Ownership $295,300
Vehicle B: Higher Acquisition Cost
Purchase price $58,200
Fuel cost over 200K miles at 13.8 MPG $50,600
Maintenance cost over lifecycle $32,400
Downtime impact (9 events at $8,500 avg) $76,500
Residual value at disposition -$18,400
Total Cost of Ownership $199,300
Vehicle B costs $9,700 more to acquire but saves $96,000 over lifecycle through superior fuel efficiency, lower maintenance requirements, better reliability, and higher resale value — 989% ROI on additional acquisition investment.
QUESTION 5

How Should Capital Budget Be Allocated Across Competing Investment Priorities?

Traditional Approach Without Data
Capital allocation determined through organizational politics, departmental advocacy, and squeaky wheel prioritization where loudest stakeholders secure funding regardless of quantitative ROI justification. Fleet investments compete against other capital needs without objective framework for comparing returns, resulting in arbitrary percentage allocations or equal distribution regardless of differential value creation potential across investment categories.
Data-Driven Approach with Fleet Analytics
ROI modeling quantifies expected returns from each capital allocation option enabling objective comparison and prioritization. Platform calculates payback period, net present value, and internal rate of return for competing investments including vehicle replacement, capacity expansion, technology upgrades, and maintenance facility improvements — providing executive leadership with quantitative decision framework rather than relying on departmental lobbying.
PRIORITY 1
Disposal of Uneconomic Assets
Immediate positive cash flow from eliminated carrying costs plus recovered capital from asset sales with zero operational impact if capacity was unutilized
PRIORITY 2
Replacement of High-Maintenance Legacy Assets
Vehicles consuming maintenance costs exceeding 40% of replacement value annually deliver 12-18 month payback through reduced repair expenses and downtime elimination
PRIORITY 3
Technology Upgrades Enabling Optimization
Predictive maintenance platforms and dispatch optimization systems unlock 15-30% efficiency gains from existing assets with 6-14 month payback versus capital expansion
PRIORITY 4
Capacity Expansion for Sustained Demand Growth
Additional vehicles justified only after optimization potential exhausted and sustained demand proven over 6+ month period rather than temporary spike

Transform Capital Planning from Guesswork to Data-Driven Optimization

FleetRabbit's integrated analytics provide the utilization tracking, lifecycle cost modeling, and predictive replacement intelligence required to answer these five critical capital investment questions with quantitative precision rather than educated guessing. Access comprehensive fleet analytics today.

FLEETRABBIT ANALYTICS ARCHITECTURE

Six Analytics Modules That Power Data-Driven Capital Decisions

FleetRabbit's capital planning intelligence emerges from integrated analytics architecture combining utilization tracking, cost accounting, predictive modeling, and comparative benchmarking across six specialized modules that collectively provide 360-degree view of fleet performance, economics, and optimization potential impossible to achieve through manual spreadsheet analysis or fragmented point solutions.

MODULE 1

Real-Time Utilization Tracking

GPS telematics and operational data integration provide continuous utilization monitoring calculating actual productive hours, idle time, and availability across every vehicle. System distinguishes productive utilization (revenue-generating operations, billable services) from non-productive movement (deadhead miles, positioning) and downtime (maintenance, storage) to reveal true asset productivity versus nominal availability.

Hourly Utilization Calculation
Platform tracks engine hours, movement time, and operational periods identifying percentage of available time spent in productive use versus idle or parked status
Comparative Analysis
Utilization metrics comparable across vehicle classes, operational divisions, and time periods revealing under-deployed assets and overutilized units requiring backup capacity
Threshold Alerting
Automated notifications when vehicles fall below utilization targets enabling proactive redeployment or disposition consideration before carrying costs accumulate
MODULE 2

Total Cost of Ownership Analytics

Comprehensive cost tracking aggregates all expenses associated with each vehicle including acquisition, fuel, maintenance, insurance, registration, depreciation, and financing costs into unified TCO model. Integration with fuel cards, maintenance systems, and accounting platforms eliminates manual data compilation providing real-time cost visibility impossible with spreadsheet-based approaches requiring monthly manual updates.

Automated Cost Aggregation
Platform pulls fuel transactions, maintenance invoices, insurance premiums, and depreciation schedules into single cost repository without manual data entry or reconciliation
Cost Per Mile and Per Hour Metrics
TCO normalized by utilization enabling fair comparison between high and low-use vehicles revealing which assets deliver best economic efficiency
Trend Analysis
Historical cost tracking identifies vehicles entering high-maintenance phase where repair expenses accelerate signaling approaching economic replacement threshold
MODULE 3

Predictive Replacement Modeling

Machine learning algorithms analyze cost trends, reliability patterns, and residual value depreciation to forecast optimal replacement timing for each vehicle. Models account for duty cycle severity, operating environment, and maintenance history to generate vehicle-specific replacement recommendations rather than applying arbitrary age or mileage thresholds uniformly across diverse fleet population.

Economic Replacement Point Prediction
AI identifies when rising maintenance costs plus declining residual value make replacement economically optimal even if vehicle remains operational
Multi-Year Planning Visibility
Platform forecasts which vehicles will reach replacement thresholds over next 12, 24, and 36 months enabling capital budgeting and procurement planning
Sensitivity Analysis
Models show how replacement timing changes under different assumptions for fuel prices, maintenance cost inflation, and utilization patterns
MODULE 4

Capacity Planning and Demand Modeling

Demand analysis correlates fleet utilization with operational activity levels identifying relationship between drilling rig count, completion stages, production volumes, and vehicle requirements. Statistical modeling forecasts future capacity needs based on projected operational activity enabling proactive fleet sizing rather than reactive scrambling when demand exceeds supply.

Historical Demand Pattern Analysis
Platform identifies seasonal fluctuations, operational cycle dependencies, and growth trends informing whether capacity gaps are temporary or sustained
Peak Demand Quantification
System calculates frequency and duration of capacity constraints enabling cost-benefit analysis of expansion investment versus rental coverage for infrequent peaks
Optimization Potential Assessment
Analytics reveal whether apparent capacity shortages result from insufficient vehicles or inefficient deployment addressable through dispatch optimization
MODULE 5

Make-Model Performance Benchmarking

Comparative analysis tracks actual performance of different makes and models across fleet population revealing which vehicles deliver superior fuel efficiency, reliability, maintenance costs, and resale value in operator-specific duty cycles and environments. Evidence-based comparison replaces manufacturer marketing claims and industry averages with real operational data from actual fleet experience.

Fuel Efficiency Comparison
Platform calculates actual MPG by make and model accounting for duty cycle differences enabling apples-to-apples comparison of fuel economy
Reliability Metrics
Unplanned downtime frequency, mean time between failures, and parts availability tracked by vehicle type identifying most and least reliable platforms
Lifecycle Cost Projection
Historical cost data from similar vehicles in fleet projects expected TCO for replacement candidates enabling informed procurement decisions
MODULE 6

ROI Calculator and Scenario Modeling

Financial analysis tools calculate return on investment, payback period, net present value, and internal rate of return for proposed capital expenditures enabling objective prioritization across competing investment opportunities. Scenario modeling capability allows exploring multiple strategies comparing outcomes under different assumptions about fuel prices, utilization growth, and operational requirements.

Investment Comparison Framework
Platform enables side-by-side comparison of competing capital allocations showing expected returns, risks, and break-even timelines for each option
Sensitivity Analysis Tools
Models show how ROI changes under different scenarios for key variables like fuel costs, utilization rates, and maintenance inflation
Executive Reporting
Financial metrics translated into executive dashboards and board presentations communicating capital requests in language leadership understands

FleetRabbit Delivers All Six Analytics Modules in Unified Platform

Unlike fragmented approaches requiring manual data compilation across spreadsheets, accounting systems, and telematics platforms, FleetRabbit integrates utilization tracking, cost accounting, predictive modeling, capacity planning, benchmarking, and ROI analysis in single comprehensive solution at transparent $3/vehicle/month all-inclusive pricing.

Schedule Analytics Demo
REAL-WORLD IMPLEMENTATION

How 240-Vehicle Fleet Saved $4.2M Through Data-Driven Capital Planning

Permian Basin operator deployed FleetRabbit analytics platform across drilling support and production services fleet discovering systematic capital misallocation, suboptimal replacement timing, and hidden capacity potential that collectively represented $4.2 million capital avoidance opportunity over three-year planning horizon while improving operational performance.

Finding One: Underutilized Asset Epidemic

Comprehensive utilization analysis revealed 38 vehicles (15.8% of fleet) operating below 30% annual utilization with combined carrying costs of $680,000 while generating operational value equivalent to only $280,000 in rental fees. Assets included backup units maintained for redundancy that statistical analysis proved unnecessary, specialty equipment for discontinued services, and vehicles assigned to low-activity operational areas where centralized pooling would provide superior economics.

Action Taken
Immediate disposition of 31 lowest-utilization units recovering $420,000 in resale proceeds
Rental contracts established for occasional peak demand coverage at $85,000 annual cost
Remaining 7 underutilized vehicles redeployed to higher-demand operational areas
$335,000
Annual Savings from Carrying Cost Elimination
Finding Two: Suboptimal Replacement Timing

Lifecycle cost modeling revealed operator's standard 150,000-mile replacement policy resulted in premature disposal of light-duty vehicles with 100,000+ remaining economical miles while severe-duty oilfield service trucks operated far past economic thresholds consuming excessive maintenance costs. Analysis showed 18 light-duty units scheduled for replacement remained well below economic replacement point while 12 heavy-duty units already exceeded optimal timing by 12-18 months.

Action Taken
Deferred replacement of 18 light-duty vehicles by 24 months saving $720,000 capital expenditure
Accelerated replacement of 12 high-maintenance heavy-duty units eliminating $180,000 annual excessive repair costs
Implemented vehicle-specific replacement policies based on duty cycle and actual cost trends rather than arbitrary mileage threshold
$1,620,000
Three-Year Savings from Optimized Replacement Timing
Finding Three: Hidden Capacity Through Optimization

Despite capacity complaints from operational managers requesting fleet expansion, utilization analysis showed average fleet-wide utilization of only 58% with high variance across vehicles. Problem stemmed not from insufficient capacity but from poor dispatch practices assigning nearest available vehicle rather than optimizing for utilization balance. Modeling showed intelligent dispatch algorithms could increase effective capacity 22% without adding vehicles.

Action Taken
Deployed FleetRabbit dispatch optimization module providing automated vehicle-to-task matching recommendations
Established utilization balancing protocols preventing assignment of overutilized units when underutilized capacity available
Avoided planned fleet expansion of 15 vehicles originally budgeted at $850,000 capital requirement
$850,000
Capital Avoidance Through Capacity Optimization
Finding Four: Suboptimal Make-Model Selection

TCO benchmarking revealed operator's standard heavy-duty truck selection (chosen for lowest acquisition cost at $48,500) actually cost $96,000 more per vehicle over lifecycle compared to alternative model with $9,700 higher purchase price but superior fuel efficiency, reliability, and resale value. With 45 units of this vehicle class in fleet and normal replacement of 8-10 units annually, suboptimal selection represented substantial ongoing economic penalty.

Action Taken
Changed procurement specifications for all heavy-duty replacements to higher-TCO-efficiency model
Accelerated replacement of 6 highest-mileage units of inefficient model to begin capturing lifecycle savings sooner
Implemented vehicle-specific economic replacement thresholds rather than uniform mileage policy
$1,380,000
Three-Year Savings from Superior Make-Model Selection
Cumulative Three-Year Impact
Underutilized asset elimination $1,005,000
Optimized replacement timing $1,620,000
Capacity optimization avoiding expansion $850,000
Superior vehicle selection $1,380,000
Total Capital Impact $4,855,000
FleetRabbit Platform Investment
$10,800 annually (240 vehicles × $3/month × 12 months) + $39,600 one-time hardware = $72,000 three-year total
Three-Year ROI 6,643%
Payback Period 5.4 Days
DATA-DRIVEN CAPITAL PLANNING

Stop Making Million-Dollar Decisions Based on Guesswork and Vendor Recommendations

FleetRabbit's integrated analytics architecture provides the utilization tracking, lifecycle cost modeling, predictive replacement intelligence, capacity planning, and ROI analysis required to transform fleet capital allocation from educated guessing into quantitative optimization delivering measurable returns through reduced capital waste, optimized replacement timing, and data-proven procurement decisions.


$4.2M
Capital Impact Case Study
$3/Vehicle
All-Inclusive Monthly Cost
6 Modules
Integrated Analytics
5 Days
Average Payback Period
Utilization Tracking TCO Analytics Replacement Modeling Capacity Planning Performance Benchmarking ROI Calculator

April 30, 2026 By David
All Posts

Share This Story, Choose Your Platform!

Latest Posts

Scroll





