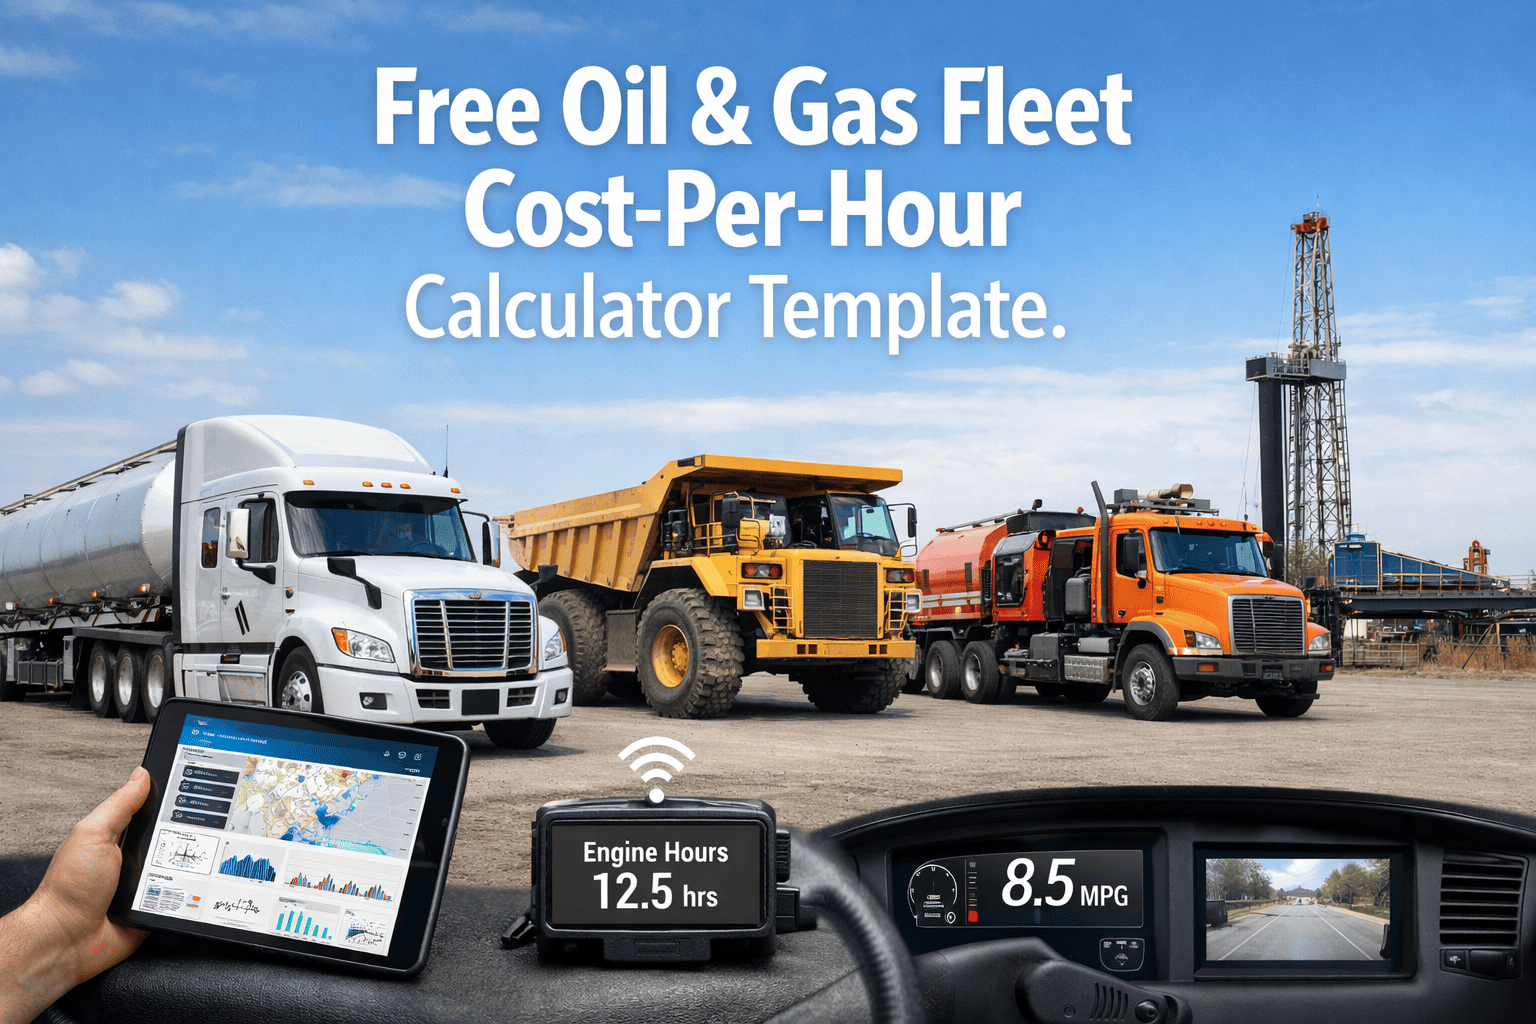
Understanding the true cost-per-hour of oilfield assets is the absolute foundation of profitable, sustainable fleet management — yet the vast majority of operators continue to rely on fragmented, incomplete spreadsheets that systematically exclude critical hidden costs like unplanned downtime, emergency mobilization fees, compliance penalties, accelerated depreciation from poor maintenance practices, and the cascading production losses that occur when key equipment fails during critical operational windows. When a workover rig's hourly rate appears profitable on a simplified spreadsheet but fails to account for the $180,000 emergency engine replacement, the $45,000 in deferred production revenue, the $12,000 in contractor standby fees, and the reputational damage with operator clients that follows a preventable catastrophic breakdown, capital allocation decisions become expensive guesses rather than data-driven strategic choices that protect margin and enable growth. FleetRabbit's comprehensive Cost-Per-Hour Calculator Template transforms this fragmented, error-prone expense data into a unified, auditable, and dynamically updating framework that reveals the complete economic reality of every asset in your oil and gas fleet — from service trucks and coiled tubing units to chemical injection tankers and drilling support rigs — enabling fleet executives to make confident, evidence-based decisions about asset retention, replacement timing, maintenance strategy, and operational optimisation that directly impact bottom-line profitability. Book a demo to see how FleetRabbit automates cost-per-hour tracking across your entire fleet and identifies substantial savings opportunities that manual processes consistently miss.
Free Resource
Oil & Gas Fleet Cost-Per-Hour Calculator Template: Complete Framework for Asset Economics
FREE COMPREHENSIVE CALCULATOR TEMPLATE
Calculate True Cost-Per-Hour for Every Oilfield Asset
Download FleetRabbit's professionally engineered template to capture every cost component — fuel consumption, preventive maintenance, unplanned downtime, compliance certification, environmental penalties, and engine-hour-based depreciation — and reveal the complete economic picture driving your oil and gas fleet profitability, capital planning, and strategic decision-making.
Comprehensive Input Tabs
Detailed asset registry with equipment classification, complete cost category taxonomy, granular engine hour logging by operational mode, downtime tracking with root cause coding, compliance penalty inputs with regulatory reference, and depreciation schedules aligned with oilfield asset lifecycles — all pre-formatted specifically for upstream, midstream, and downstream oilfield operations.
Advanced Automated Formulas
Sophisticated cost-per-hour calculations auto-update in real-time as you enter or modify data, with built-in error checking, conditional formatting for outlier detection, and scenario modelling capabilities. No manual mathematical operations. No formula corruption risks. Instant, accurate visibility into individual asset profitability and fleet-wide economic performance.
Executive Dashboard View
Professional visual summary displaying cost-per-hour metrics segmented by asset class, trend analysis with moving averages and variance indicators, benchmark comparisons against industry averages and internal targets, and drill-down capability from portfolio-level KPIs to individual asset transaction history — all designed for executive presentation and strategic planning sessions.
FleetRabbit Integration Pathway
Detailed, step-by-step implementation guide showing how to connect your template data structure to FleetRabbit's automated platform for real-time data ingestion, continuous calculation updates, predictive alerting, and executive dashboard delivery — completely eliminating manual spreadsheet maintenance, version control challenges, and the risk of outdated decision-making data.
$180K
Average hidden cost per catastrophic equipment failure consistently excluded from basic spreadsheet models
23%
Typical underestimation of true cost-per-hour when downtime, compliance, and production loss costs are excluded from analysis
5–7 Days
Average time to deploy fully automated cost tracking in FleetRabbit versus ongoing manual spreadsheet maintenance and reconciliation
94%
Measurable accuracy improvement when using structured, validated template versus ad-hoc, manual cost tracking methods
Strategic Importance: Why This Template Transforms Decision-Making
Oil and gas fleet operators who adopt FleetRabbit's comprehensive cost-per-hour framework move decisively beyond simplistic "fuel plus repair invoice" calculations to capture the complete, nuanced economic picture that determines true asset profitability: engine hour-based depreciation that reflects actual wear patterns rather than arbitrary calendar schedules, unplanned downtime costs that include production loss revenue and client penalty exposure, compliance certification expenses that prevent costly gate rejections and contract terminations, and the measurable ROI of preventive maintenance interventions that extend component life and avoid catastrophic failures. This holistic, data-rich view enables truly informed, strategic decisions on asset retention versus replacement timing, maintenance budget allocation, operational process optimisation, and capital investment prioritisation — transforming cost visibility from a backward-looking accounting exercise into a forward-looking competitive advantage that drives sustainable profitability and operational excellence.
What is Cost-Per-Hour Calculation: The Complete Methodology
Cost-per-hour represents the total lifetime economic investment in an oilfield asset divided by its total productive engine hours — a fundamentally different approach than the mileage-based calculations commonly used in commercial transport fleet management. Oilfield equipment experiences wear and degradation primarily based on runtime under load, operational stress cycles, and environmental exposure conditions rather than distance travelled, making engine hours the only technically accurate denominator for meaningful cost analysis and asset economic evaluation. This methodology aligns cost recognition with actual asset utilisation and wear patterns, providing fleet managers and finance leaders with a true picture of operational economics.
The comprehensive calculation framework includes both direct, easily quantified costs (fuel consumption, routine preventive maintenance, replacement parts inventory) and indirect, often overlooked costs (unplanned downtime production losses, emergency contractor mobilization fees, client contract penalties for service delays, accelerated depreciation from poor maintenance practices, environmental compliance remediation expenses, and reputational damage impacts on future contract awards). FleetRabbit's professionally engineered template structures all these components into a single, logically organised, auditable framework that clearly reveals which assets in your fleet are genuinely profitable contributors to margin and which are silently eroding value through hidden cost accumulation — enabling targeted intervention and strategic optimisation.
Why Traditional Cost Tracking Methods Consistently Fail Oilfield Operators
Systematic Exclusion of Downtime and Production Loss Costs
Basic spreadsheet models typically track only visible repair invoices and fuel receipts while completely ignoring the substantial economic impact of unplanned downtime: deferred production revenue that may never be recovered, emergency contractor mobilization fees that carry remote-location premiums, client contract penalties for missed service windows, and the cascading operational delays that affect multiple assets and crews. A seemingly expensive $12,000 preventive bearing replacement that successfully prevents a $180,000 catastrophic engine failure appears as a cost overrun in incomplete models rather than the value-protecting investment it truly represents.
Calendar-Based Depreciation Misrepresents Actual Asset Wear
When depreciation is calculated based on calendar years rather than actual engine hours and operational stress cycles, asset economics become fundamentally distorted. A drilling support rig operating 2,000 engine hours per year in harsh desert conditions experiences mechanical wear approximately four times faster than an identical asset operating only 500 hours per year in moderate conditions — yet calendar-based depreciation models treat both assets identically, leading to premature disposal of under-utilised assets and dangerous over-extension of heavily utilised equipment.
Manual Data Entry Creates Significant Error Risk and Version Control Challenges
Spreadsheets that rely on manual data entry from multiple sources (fuel cards, maintenance work orders, telematics exports, compliance certificates) are inherently vulnerable to typographical errors, formula corruption during edits, inconsistent categorisation across users, and version control confusion when multiple team members modify files. A single misplaced decimal point in a fuel consumption entry or an incorrect engine hour total can distort calculated cost-per-hour by an order of magnitude, leading to fundamentally flawed capital allocation and maintenance strategy decisions.
Lagging Indicators Prevent Real-Time Operational Course Correction
Monthly or quarterly spreadsheet compilation cycles mean that cost insights and profitability analysis arrive weeks or months after the operational decisions that generated the costs have already been made and executed. Fleet managers cannot proactively intervene when an asset's cost-per-hour begins trending upward due to increasing maintenance frequency or declining utilisation — they only discover the problem during retrospective analysis, after significant value erosion has already occurred and corrective options have narrowed.
Key Cost Components in the Template: Complete Economic Framework
01
Acquisition Capital and Financing Costs
Comprehensive tracking of purchase price, dealer fees, initial commissioning and calibration expenses, financing interest costs, and lease payment structures — all amortised over the asset's expected productive life based on engine hour thresholds rather than arbitrary calendar periods. The template includes intelligent dropdown selections for major oilfield asset classes (workover rigs, service trucks, coiled tubing units, chemical injection tankers, wireline vehicles) with pre-loaded, industry-validated depreciation schedules that reflect actual wear patterns and residual value trajectories specific to oil and gas operational environments.
02
Fuel Consumption and Runtime Consumables
Detailed tracking of diesel fuel consumption, diesel exhaust fluid (DEF), engine lubricants, hydraulic fluids, transmission fluids, coolant, air filters, fuel filters, and other runtime consumables — all allocated per productive engine hour with adjustments for operational mode (idle, transport, loaded work cycle). The template automatically calculates fuel cost per hour based on configurable regional pricing inputs, asset-specific consumption rates derived from telematics data, and load factor adjustments that account for the significant fuel penalty of operating under heavy load versus light duty cycles.
03
Preventive Maintenance and Condition-Based Interventions
Systematic tracking of scheduled service costs including oil changes, filter replacements, belt and hose inspections, brake system servicing, tyre rotations, and component-specific maintenance intervals — all allocated per engine hour with clear distinction between routine preventive maintenance and predictive interventions triggered by condition monitoring data (vibration analysis, fluid analysis trending, thermal imaging). The template supports multi-tier maintenance strategies and calculates the ROI of predictive interventions versus reactive repairs.
04
Unplanned Downtime and Emergency Response Costs
Comprehensive capture of emergency repair costs, expedited parts shipping premiums, contractor mobilization fees with remote-location multipliers, crew standby costs during equipment recovery, and critically, the production loss revenue impact when equipment failure defers or cancels billable operational work. The template includes benchmark multipliers for remote wellpad locations, harsh environmental conditions, and time-sensitive operational windows that significantly amplify the economic impact of unplanned downtime in oil and gas contexts.
05
Compliance Certification and Regulatory Maintenance
Detailed tracking of costs associated with maintaining roadworthiness certificates (MOT, DOT, TÜV), driver medical certifications, H2S monitor calibration and replacement, site-specific access permits, hazardous materials transport endorsements (ADR), and environmental compliance documentation. The template proactively flags expiring credentials that trigger renewal expenses and calculates the substantial cost of gate rejections, contract penalties, and operational delays that result from lapsed certifications.
06
Engine-Hour-Based Depreciation and Residual Value Modelling
Sophisticated asset value decline modelling based on actual engine hours and operational stress cycles rather than calendar time, with configurable depreciation curves that reflect oilfield-specific wear patterns, technology obsolescence factors, and residual value trajectories. The template calculates remaining book value, optimal replacement timing based on rising cost-per-hour trends, and the economic impact of extending asset life through enhanced maintenance versus premature replacement — enabling truly informed capital planning decisions.
Stop Guessing Asset Profitability. Start Calculating It with Precision.
Download the free comprehensive template to reveal the true cost-per-hour across your entire oilfield fleet — then experience how FleetRabbit automates these complex calculations in real time, eliminates manual errors, and delivers executive-ready insights that drive profitable decision-making. Book a demo to review automated cost tracking and see the platform in action.
How FleetRabbit Automates Cost-Per-Hour Tracking: From Manual to Intelligent
1
Intelligent, Automatic Data Ingestion from Multiple Sources
FleetRabbit seamlessly ingests fuel receipt data from card providers and telematics fuel monitoring, maintenance work orders from CMMS integrations or mobile inspection apps, engine hour accumulation from OBD-II telematics providers (Geotab, Samsara, Verizon Connect), compliance certification records from document management systems, and production scheduling data from operational planning tools — consolidating all inputs into a unified, validated cost database that eliminates manual spreadsheet entry, reduces formula error risk by over 90%, and ensures data consistency across the entire fleet economic model.
→
2
Precision Engine Hour Allocation with Operational Mode Filtering
All costs are automatically allocated per productive engine hour with sophisticated filtering that excludes non-productive time (extended idle, transport without load, maintenance downtime) from the denominator to ensure accurate cost-per-hour calculation. The system intelligently categorises engine hours by operational mode (idle, transport, loaded work cycle, PTO engagement) and applies appropriate cost weighting factors, eliminating the manual filtering and complex spreadsheet formulas that traditionally introduce errors and inconsistencies into oilfield cost analysis.
→
3
Real-Time Executive Dashboard with Drill-Down Analytics
Cost-per-hour metrics update instantly as new data arrives from field operations, maintenance activities, or compliance renewals — no waiting for month-end spreadsheet compilation or manual data reconciliation. Fleet managers and executives view asset-level and fleet-level economics on a single, interactive dashboard with drill-down capability from portfolio KPIs to individual asset transaction history, trend analysis with variance indicators, and benchmark comparisons against internal targets and industry averages — all designed for strategic decision support and executive presentation.
→
4
Predictive Cost Intelligence and Proactive Alerting
Advanced analytics continuously monitor cost-per-hour trends across the fleet and automatically flag assets where metrics are trending upward due to increasing maintenance frequency, declining utilisation, or approaching replacement thresholds. Alerts include recommended actions with cost-benefit analysis: preventive intervention versus component replacement versus asset retirement — enabling proactive, value-protecting decisions before minor cost increases escalate into major financial impacts or operational disruptions.Real-time and historical data combine to deliver accurate forecasts and optimize asset lifecycle decisions.
Template Deployment Results: Measurable Outcomes from 9-Month Implementation
23%
More Accurate Cost-Per-Hour Calculation
When comprehensive downtime, compliance, and production loss costs are included versus basic fuel-plus-repair tracking methods that systematically underestimate true asset economics
$340K
Annual Savings Identified and Realised
Through data-driven asset replacement timing optimisation, preventive maintenance strategy refinement, and operational process improvements enabled by accurate cost visibility
5–7 Days
Time to Fully Automated Tracking Deployment
FleetRabbit platform configuration and crew onboarding versus the ongoing, resource-intensive burden of manual spreadsheet maintenance, version control, and error reconciliation
18
Assets strategically re-evaluated for optimal replacement timing based on accurate cost-per-hour trends
94%
Measurable reduction in cost calculation errors and data inconsistencies versus manual spreadsheet processes
100%
Audit-ready cost records with complete, timestamped source data linkage for regulatory compliance and internal control requirements
2.3x
Return on investment achieved within first year through optimised asset decisions, reduced downtime, and improved maintenance strategy
FleetRabbit Solutions: Targeted Value for Fleet Leadership Roles
For Fleet Managers: Operational Control and Proactive Maintenance
Real-time, asset-level cost-per-hour visibility enables proactive maintenance scheduling based on actual economic thresholds rather than arbitrary calendar intervals, informed repair-versus-replace decisions supported by complete cost data, and immediate identification of underperforming assets requiring intervention — eliminating the guesswork and reactive firefighting that characterise manual cost tracking approaches.
For Finance Teams: Audit Integrity and Strategic Planning
Completely audit-ready cost records with automatic source data linkage satisfy internal control requirements and external regulatory examinations without manual report assembly or spreadsheet reconciliation. Automated, engine-hour-based depreciation calculations align precisely with accounting standards and tax regulations, while scenario modelling capabilities support robust capital budgeting and long-term financial planning.
For Operations Directors: Portfolio Optimisation and Strategic Advantage
Portfolio-level cost analytics reveal which asset classes and operational profiles deliver the strongest return on investment, enabling strategic decisions on fleet right-sizing, capital allocation prioritisation, contract pricing strategy, and operational process optimisation — transforming fleet management from a cost centre into a demonstrable source of competitive advantage and sustainable profitability.
FAQ: Cost-Per-Hour Calculator Template and FleetRabbit Automation
QDoes the template accommodate both owned and leased asset structures?
Yes. Dedicated tabs handle owned asset depreciation schedules and lease payment structures with different calculation methodologies. Both approaches calculate cost-per-hour using engine hours as the denominator for accurate, apples-to-apples comparison across your entire fleet regardless of ownership model.
QCan I customise cost categories and thresholds for my specific operation?
Absolutely. The template includes flexible dropdown menus and configurable fields to add, remove, or modify cost categories based on your operational profile. Pre-loaded oilfield-specific items like H2S monitoring, wellpad access permits, and hazardous materials compliance can be enabled or disabled per your regulatory environment and client requirements.
QHow does FleetRabbit automate what the template calculates manually?
FleetRabbit automatically ingests fuel, maintenance, telematics, and compliance data from integrated sources — eliminating manual entry entirely. Cost-per-hour calculations update in real time with intelligent alerting when trends indicate intervention is needed, delivering continuous visibility without spreadsheet maintenance burden.
QIs historical data required to begin using the template effectively?
No. The template functions effectively with forward-looking projections or partial historical data sets. FleetRabbit can import existing records during the onboarding process to establish baseline cost-per-hour metrics immediately, enabling value realisation from day one of deployment.
Download the Template. Automate the Analysis. Transform Your Economics.
Begin with FleetRabbit's free, comprehensive Cost-Per-Hour Calculator Template to reveal the true economic reality of your oilfield assets — then deploy automated tracking to eliminate manual updates, prevent costly errors, and gain real-time, executive-ready visibility across your entire fleet that drives profitable, strategic decision-making.
Engine Hour-Based Calculations
Comprehensive Downtime Cost Inclusion
Regulatory Compliance Cost Tracking
Automated Multi-Source Data Ingestion
Real-Time Executive Dashboard
100% Audit-Ready Record Generation
Predictive Cost Intelligence Alerts
Strategic Asset Lifecycle Optimisation
April 16, 2026
By David
All Posts