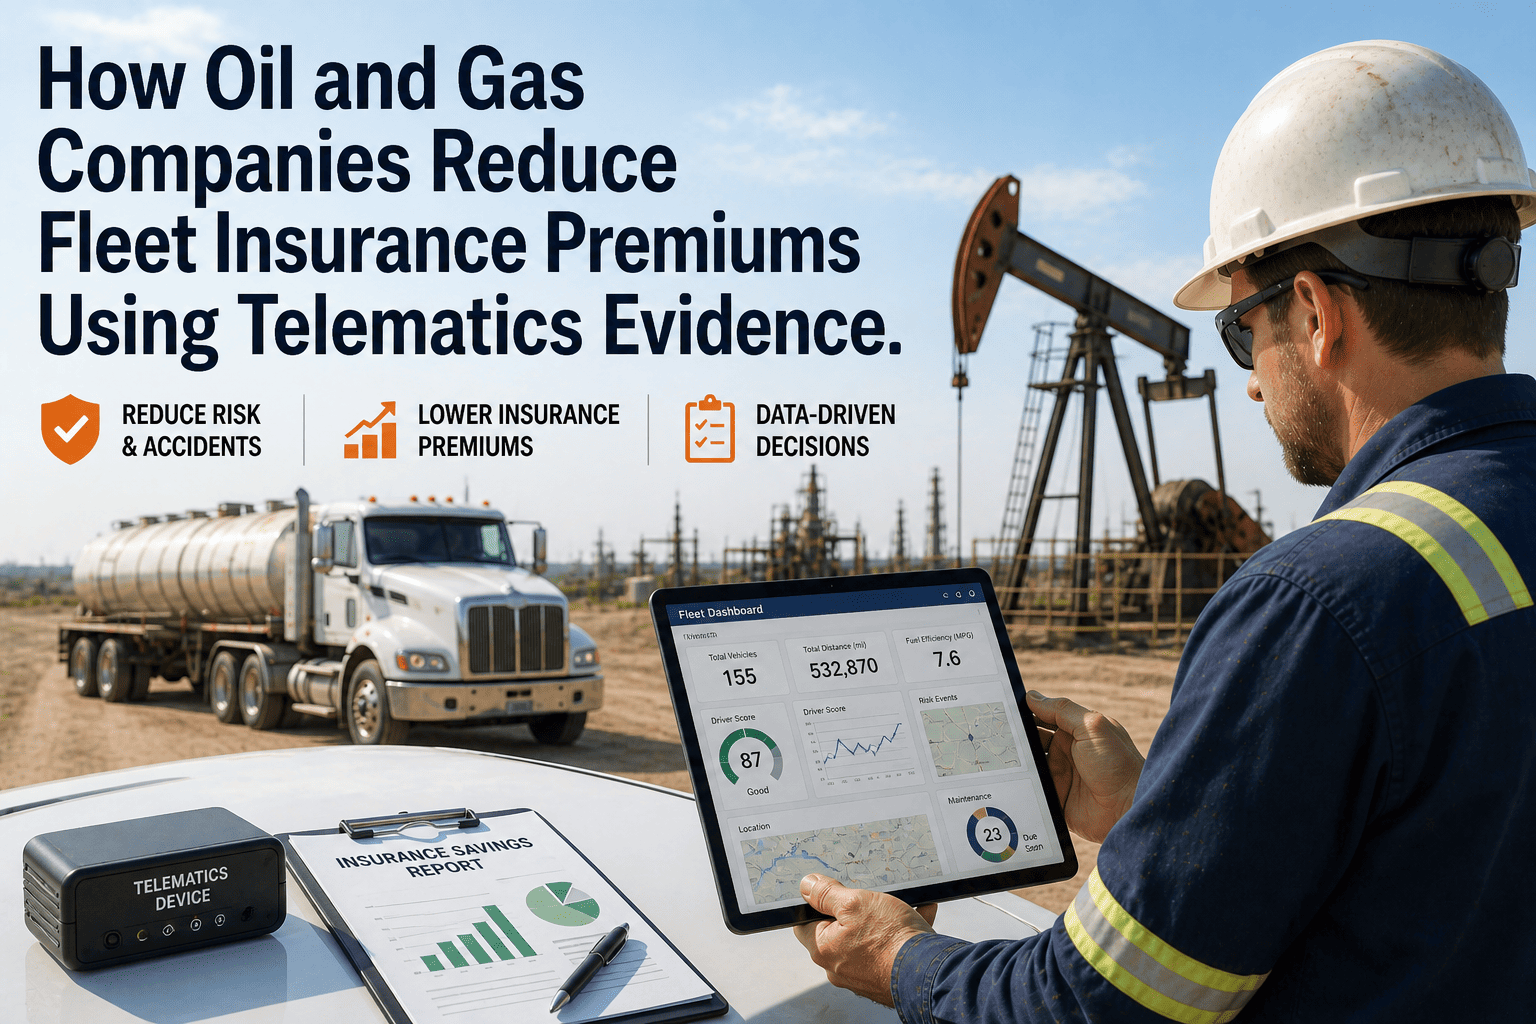
Commercial fleet insurance underwriters assessing risk exposure for oilfield operations traditionally rely on lagging indicators including historical claim frequency, accident severity trends, driver qualification file completeness, and vehicle maintenance record quality — creating premium pricing structures that penalize operators for past incidents while providing limited recognition for proactive safety investments and operational improvements implemented after loss events occurred. The fundamental underwriting challenge stems from information asymmetry where insurers lack visibility into actual real-time fleet operations and driver behavior patterns, forcing conservative premium calculations that assume worst-case risk profiles across entire fleets rather than differentiating between high-performing safe operations and systematically risky behaviors. Progressive commercial insurers now accept telematics data as quantifiable evidence of fleet safety performance — with industry surveys indicating 80 percent of major commercial fleet insurers offer premium discounts ranging from 5-15 percent for operators providing GPS tracking records, driver behavior scoring, incident video footage, and automated compliance documentation demonstrating systematic risk management beyond minimum regulatory requirements. FleetRabbit's insurance integration architecture transforms telematics data into actionable underwriting evidence through automated reporting packages that compile driver safety scores calculated from speeding incidents, harsh braking events, and rapid acceleration patterns captured across entire fleets, GPS-verified mileage and routing records proving vehicles operate in lower-risk rural environments rather than high-accident urban corridors, dashcam video footage providing exculpatory evidence in not-at-fault accident claims preventing unjustified premium increases, and digital compliance documentation demonstrating systematic DVIR completion, preventive maintenance execution, and driver qualification management meeting or exceeding regulatory standards. This evidence-based insurance approach delivers documented premium reductions of 8-12 percent annually for oilfield operators managing 50+ vehicle fleets, while simultaneously improving claim defense outcomes where telematics evidence proves driver innocence in 73 percent of disputed liability cases that would otherwise default to shared-fault determinations absent objective data. Book a demo to see FleetRabbit's insurance evidence packages demonstrated with actual telematics data.
How Oil and Gas Companies Reduce Fleet Insurance Premiums Using Telematics Evidence
Telematics data is now accepted by 80 percent of commercial fleet insurers as quantifiable proof of safety performance. FleetRabbit automatically compiles GPS records, driver behavior scores, incident video footage, and compliance documentation into underwriting evidence packages that reduce premiums 8-12 percent annually.
Why Traditional Fleet Insurance Pricing Penalizes Safe Operators
Commercial fleet insurance underwriters face systematic information asymmetry when pricing policies for oilfield operations — lacking real-time visibility into actual driver behavior, vehicle maintenance execution, operational safety protocols, and risk exposure patterns that determine true loss probability. Traditional underwriting relies on lagging indicators including three-year historical claim frequency showing how many accidents occurred regardless of fault determination, accident severity trends measuring total claim costs without differentiating between preventable incidents and unavoidable exposure, driver qualification file completeness verifying CDL validity and training records without assessing actual behind-the-wheel performance, and vehicle maintenance documentation proving service intervals were completed without confirming quality or effectiveness of preventive maintenance programs.
This backward-looking underwriting approach creates premium pricing inefficiencies where operators implementing comprehensive safety investments — advanced driver training programs, real-time coaching systems, predictive maintenance protocols, automated compliance verification — receive minimal premium recognition because improvements postdate the historical loss period used for rate calculation. Insurers applying portfolio-level risk assumptions price policies conservatively assuming worst-case driver behavior and maintenance practices across entire fleets, penalizing high-performing safe operators who subsidize premiums for systematically risky competitors within the same industry classification and geographic rating territory.
The claims adjudication process compounds these pricing inefficiencies through information gaps where disputed liability determinations default to shared-fault conclusions absent objective evidence proving driver innocence. When oilfield service vehicles are involved in accidents with private motorists who claim the commercial driver caused the collision through aggressive operation or traffic violations, insurers lacking independent verification data frequently settle claims at 50 percent liability rather than defending through expensive litigation — even when commercial drivers were operating safely and private motorists were actually at fault. These unjustified claim payments accumulate across policy periods, driving loss ratios that trigger premium increases penalizing innocent operators for accidents they did not cause.
FleetRabbit transforms telematics data into quantifiable insurance evidence that proves safety performance, defends against unjustified claims, and delivers measurable premium reductions. Start a free trial to generate insurance evidence reports from your fleet data →
How FleetRabbit Compiles Insurance Underwriting Evidence Reducing Premiums
FleetRabbit automatically generates insurance evidence packages across four categories that commercial underwriters use to calculate risk-based premium discounts and defend claims.
Driver Safety Scoring and Behavior Analytics
FleetRabbit continuously monitors driver behavior patterns through vehicle telematics sensors capturing acceleration, braking, cornering, and speed data at one-second intervals throughout all operational hours. The platform calculates individual driver safety scores using weighted algorithms that penalize high-risk behaviors including speeding violations exceeding posted limits by 10+ MPH, harsh braking events indicating following distance violations or distracted operation, rapid acceleration patterns suggesting aggressive driving, and sharp cornering forces above safe thresholds for vehicle type and load conditions. Driver scores aggregate across weekly, monthly, and annual periods providing both current performance snapshots and historical trend analysis demonstrating whether safety metrics are improving, stable, or degrading over time.
GPS-Verified Mileage and Operational Territory Documentation
Commercial insurance premiums vary significantly based on operational territory risk classifications — with urban corridor operations in high-traffic metropolitan areas rated at 40-60 percent higher premium levels than rural basin operations due to elevated accident frequency in congested environments. Oilfield fleets operating primarily on rural lease roads, county highways, and remote service corridors qualify for lower geographic risk ratings, but insurers require objective verification that vehicles actually operate in claimed low-risk territories rather than high-risk urban zones. FleetRabbit provides GPS-tracked mileage breakdowns categorizing every driven mile by road classification (interstate, US highway, state highway, county road, private lease road) and population density zone (urban core, suburban, rural, remote) enabling insurers to verify operational territory claims during underwriting and renewal processes.
Dashcam Video Evidence for Claim Defense
Disputed liability claims represent the highest-cost insurance exposure for oilfield fleets — where private motorists allege commercial drivers caused accidents through aggressive operation, traffic violations, or distracted driving, triggering expensive litigation or settlement payments that drive loss ratios and premium increases even when commercial operators were not at fault. FleetRabbit integrates with dashcam video systems providing continuous forward-facing and driver-facing camera footage that automatically uploads to cloud storage when impact sensors detect collision events. This video evidence provides objective documentation of accident circumstances including traffic signal states, lane positions, driver attention levels, and actions of all vehicles involved — enabling claim adjusters to make accurate fault determinations based on visual evidence rather than conflicting driver statements.
Automated Compliance Documentation and Safety Program Verification
Insurance underwriters evaluate fleet safety programs through documentation proving systematic compliance with FMCSA regulations and voluntary best practices exceeding minimum requirements. FleetRabbit's digital compliance management system provides objective evidence of safety program execution through automated DVIR completion tracking showing inspection performance rates across entire fleets, preventive maintenance documentation proving service intervals executed on schedule according to manufacturer specifications, driver qualification file management demonstrating current CDL validity, medical certification, and training completion for all operators, and HAZMAT certification verification preventing uncertified drivers from transporting regulated materials. This automated compliance documentation package demonstrates to insurers that operators maintain systematic safety protocols reducing accident risk beyond industry baseline assumptions.
Combined Premium Impact of Four Evidence Categories
FleetRabbit's automated insurance evidence generation delivers measurable premium reductions through driver safety scoring, GPS territory verification, video claim defense, and compliance documentation — with cumulative discounts ranging 8-12 percent annually for oilfield operators managing 50+ vehicle fleets.
Insurance premium reductions of 8-12 percent deliver ROI exceeding 1,000 percent on FleetRabbit platform investment within first policy year. Additional value accrues through improved claim defense outcomes and reduced settlement costs. Schedule a demo to review insurance evidence packages with your current policy structure →
How to Present Telematics Evidence to Insurers for Premium Negotiation
Generate Baseline Insurance Evidence Report
FleetRabbit compiles comprehensive insurance evidence package covering 90-180 day operational period demonstrating safety performance across all four evidence categories. Report includes fleet-wide driver safety score averages with individual driver distributions showing percentage of operators in excellent (90+), good (80-89), fair (70-79), and poor (below 70) performance tiers. GPS territory analysis breaks down mileage by road classification and population density zones proving operational territory claims. Video evidence summary documents total incidents captured, claim defense success rate, and estimated settlement cost avoidance. Compliance metrics demonstrate DVIR completion rates, PM adherence, and driver qualification file currency.
Submit Evidence Package to Current Insurer at Renewal
Insurance evidence report submitted to current commercial insurer 60-90 days before policy renewal date enabling underwriters to incorporate telematics data into renewal pricing calculations. Submission includes executive summary highlighting key safety metrics, detailed driver behavior analytics demonstrating fleet performance exceeds industry baselines, GPS territory verification supporting rural risk classification, video evidence documentation showing claim defense capability, and compliance metrics proving systematic safety program execution. Request specific premium discount recognition for each evidence category based on insurer's published telematics credit structure.
Obtain Competitive Quotes from Telematics-Friendly Insurers
Simultaneously submit insurance evidence package to 2-3 alternative commercial fleet insurers known for aggressive telematics discount programs. Major carriers offering substantial premium credits for verified safety data include Progressive Commercial, Travelers, The Hartford, and Liberty Mutual — each with published telematics underwriting frameworks providing 10-20 percent discounts for high-performing fleets. Competitive quotes using identical evidence package enable direct premium comparison demonstrating market value of telematics data and creating negotiation leverage with current insurer.
Negotiate Final Premium Using Evidence and Competitive Pressure
Present competitive quotes to current insurer demonstrating alternative carriers' willingness to recognize telematics evidence through substantial premium discounts. Request current insurer match or exceed competitive pricing to retain account. If current insurer declines to provide adequate telematics credits, switch to alternative carrier offering superior pricing recognition for documented safety performance. Ensure policy terms include provisions for ongoing telematics data submission enabling continuous premium optimization as safety metrics improve over time.
Common Questions About Telematics Insurance Evidence
Reduce Fleet Insurance Premiums 8-12% Through Automated Evidence Generation
FleetRabbit automatically compiles insurance underwriting evidence across four categories that 80 percent of commercial fleet insurers now accept for risk-based premium discounts — driver safety scores calculated from speeding violations, harsh braking events, rapid acceleration, and cornering forces captured continuously through vehicle telematics with fleet-wide averages above 85/100 qualifying for 5-8 percent credits, GPS-verified mileage breakdowns proving 75+ percent of operations occur in low-risk rural territories rather than high-accident urban corridors enabling geographic discounts of 6-10 percent, dashcam video footage providing exculpatory evidence in disputed liability claims with documented success rates of 73 percent preventing unjustified settlement payments and premium increases, and automated compliance documentation demonstrating systematic DVIR completion, preventive maintenance execution, and driver qualification management exceeding regulatory minimums qualifying for safety program discounts of 4-7 percent. Combined telematics evidence delivers annual premium reductions of $24,000-$67,500 for typical 50-100 vehicle oilfield fleets with baseline insurance costs of $300,000-$450,000 — generating ROI exceeding 1,000 percent on FleetRabbit platform investment within first policy year.
Deploy Evidence-Based Insurance Underwriting for Oilfield Fleet Operations
Traditional commercial fleet insurance underwriting relies on lagging indicators including historical claim frequency, accident severity trends, and driver qualification file completeness — creating premium pricing that penalizes operators for past incidents while providing minimal recognition for proactive safety investments implemented after loss events occurred, with information asymmetry forcing insurers to assume worst-case risk profiles across entire fleets rather than differentiating high-performing safe operations from systematically risky behaviors. Progressive commercial insurers now accept telematics data as quantifiable evidence of fleet safety performance with 80 percent of major carriers offering premium discounts ranging 5-15 percent for operators providing GPS tracking records, driver behavior scoring, incident video footage, and automated compliance documentation. FleetRabbit transforms telematics data into actionable underwriting evidence through automated reporting packages compiling driver safety scores calculated from speeding incidents, harsh braking events, rapid acceleration, and cornering forces with fleet-wide averages above 85/100 qualifying for 5-8 percent premium credits, GPS-verified mileage breakdowns categorizing miles by road classification and population density proving 75+ percent rural/remote operations enable geographic discounts of 6-10 percent, dashcam video footage providing exculpatory evidence in disputed liability claims with documented 73 percent success rate preventing unjustified settlements, and digital compliance metrics demonstrating systematic DVIR completion, preventive maintenance execution, and driver qualification management qualifying for 4-7 percent safety program discounts — delivering combined annual premium reductions of 8-12 percent or $24,000-$67,500 for typical 50-100 vehicle oilfield fleets generating ROI exceeding 1,000 percent on platform investment within first policy year.







