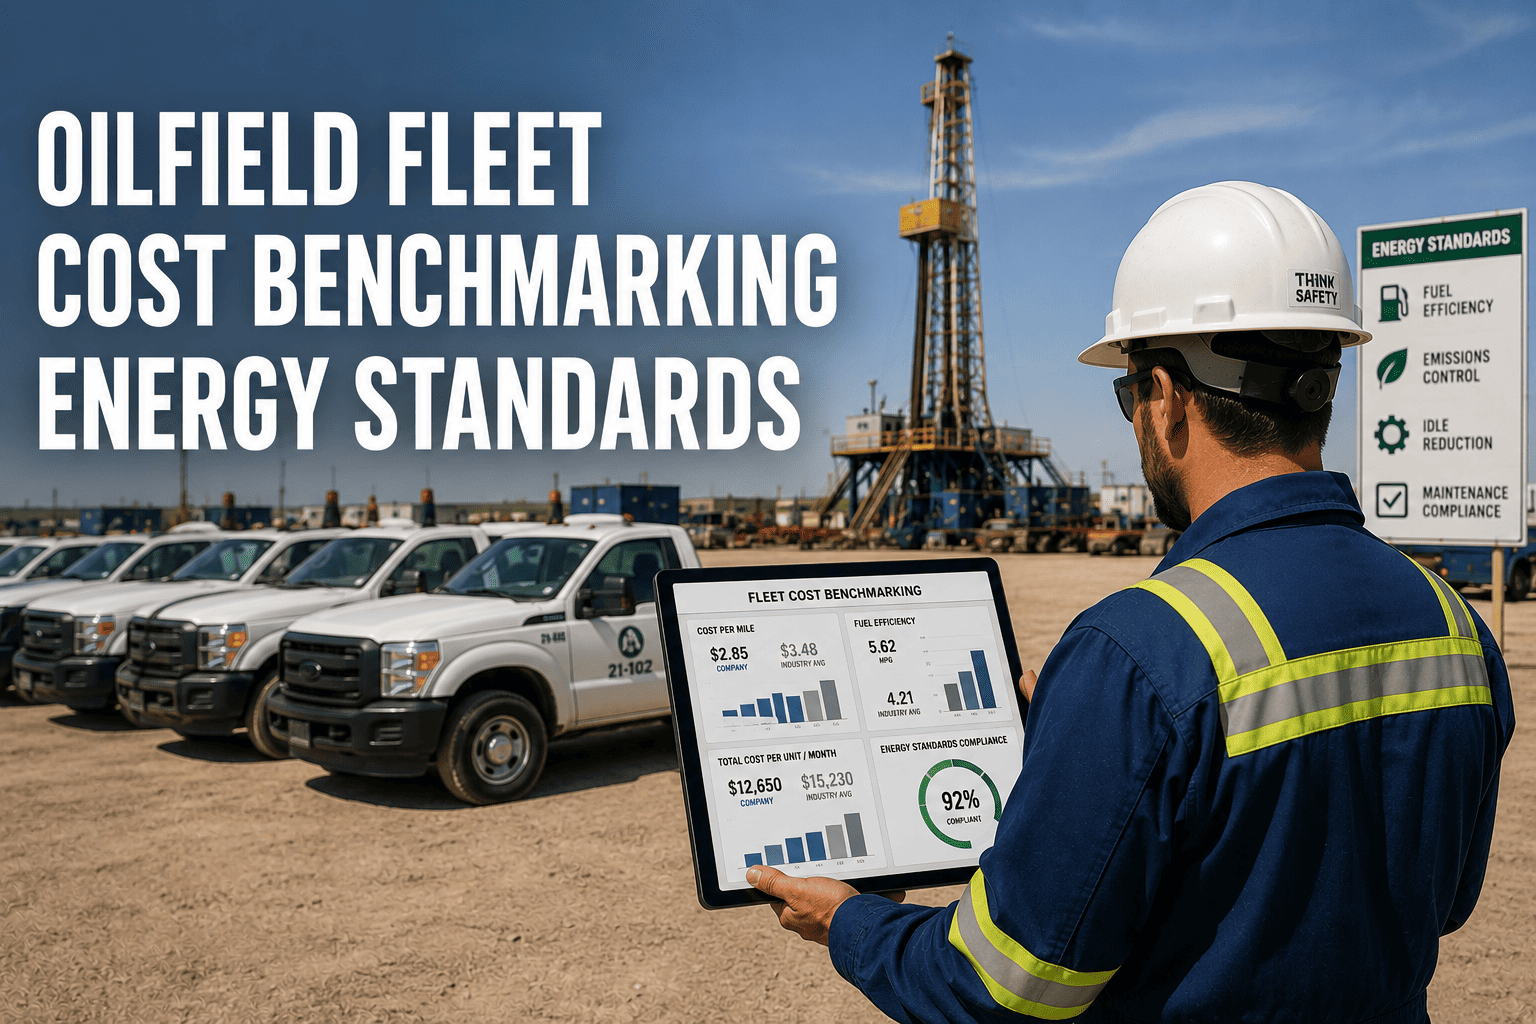
A number without context is just a number. A drilling operator running 92 percent equipment availability might feel like that fleet is performing fine, until the industry median across comparable operations turns out to be 97 percent. A service fleet manager budgeting 18000 dollars per vehicle annually for maintenance might never realize peer operators are running the same equipment for 12400 dollars, because there was never a reliable benchmark to compare against. Cost benchmarking is not about chasing a perfect number. It is about knowing whether the number you already have is actually good, or just familiar.
Oil and gas peer operators average 12400 dollars per vehicle annually in maintenance costs against a common but unexamined 18000 dollar budget. Industry-median equipment availability sits at 97 percent, well above the 92 percent many operators consider acceptable, and fuel alone represents 35 to 45 percent of total oilfield fleet operating expenditure, the single largest category worth benchmarking first.
The Benchmarks Every Oilfield Fleet Manager Should Know
These four metrics carry the largest gaps between what feels acceptable inside a single operation and what comparable fleets are actually achieving. Seeing both numbers side by side is usually the fastest way to find where real savings are hiding.
Equipment Availability
A 5-point gap across a large fleet translates into a meaningful number of vehicles unavailable on any given day that peer operators simply do not carry.
Maintenance Cost Per Vehicle
Across a 50-vehicle fleet, that gap alone represents roughly 280000 dollars a year in maintenance spend above what comparable operators pay.
Fuel Share Of Operating Cost
Fuel is the single largest oilfield fleet cost category, and the one with the highest concentration of waste that aggregate monthly reporting cannot isolate.
Unplanned Vs Scheduled Repair Cost
Emergency mobilization, expedited parts, and cascading damage make unplanned repairs cost more than double a scheduled service for the same component.
FleetRabbit compares your cost per mile, availability, and maintenance spend against comparable oilfield operators, not generic trucking averages. Sign up free and see exactly where your fleet sits today.
Where Cost Per Mile Actually Hides Its Waste
Cost per mile is the single most comprehensive fleet metric because it folds fuel, maintenance, idle time, and inefficient routing into one number. The problem is that most fleets calculate only direct costs and miss 20 to 30 percent of their true cost per mile because idle time and downtime rarely get attributed correctly.
The Three Components Fleets Underestimate
Idle accumulation at remote wellsite staging areas can run 40 to 52 percent of engine hours during winter operations. Circuitous routing across unmapped lease road networks adds 10 to 16 percent excess mileage that standard navigation tools cannot correct because lease roads do not exist in commercial mapping databases. Harsh acceleration and aggressive braking add another 8 to 12 percent in fuel consumption on top of both.
Why Mileage-Based Budgets Miss The Mark
Oilfield fuel budgets built on mileage-based consumption models produce systematic variance of 25 to 40 percent because most fuel is burned during wellsite idle and high-load pump operation, not transit. Budgets built from engine-hour consumption baselines instead achieve accuracy under 5 percent within 30 days.
| Cost Component | Typical Hidden Waste | What Fixes It |
|---|---|---|
| Idle Fuel Burn | 45 dollars per vehicle per day | Real-time idle alerts and driver coaching |
| Circuitous Routing | 12 to 18 percent excess mileage | GPS route analysis on actual lease roads |
| Harsh Driving Events | 8 to 12 percent extra fuel use | Driver behavior scoring and coaching |
| Budget Forecasting Error | 25 to 40 percent variance, mileage models | Engine-hour consumption baselines |
What A Real Benchmarking Exercise Finds
Numbers on a slide are useful, but the value of benchmarking shows up when it is applied to an actual fleet. A 90-day utilization analysis of a 50-vehicle oilfield fleet, using a 4000-mile-per-month threshold, is a good example of what surfaces once the comparison actually happens.
The Underutilized Asset Problem
Eight vehicles in that fleet were found chronically underutilized, each costing 1600 dollars a month in lease, insurance, and overhead with minimal productivity to show for it. Disposing of those eight units, while retaining two as backup capacity for demand spikes, avoided 153600 dollars in annual cost that had been sitting invisible inside a fleet that otherwise looked fully staffed.
Route And Idle Corrections Compound Fast
The same benchmarking exercise found that a 15 percent reduction in average daily miles driven, achieved through route correction alone, saved roughly 158000 dollars annually across the fleet once fuel cost per mile was applied to the miles eliminated.
FleetRabbit calculates cost-per-mile, cost-per-hour, and cost-per-project automatically from your GPS, fuel card, and maintenance data. Book a free demo and we will run this same analysis against your own fleet.
Setting Your Own Target Range
Once your fleet's actual numbers are visible, the next step is deciding which tier you are aiming for. These ranges give a realistic picture of where most oilfield fleets fall today.
| Metric | Needs Attention | Industry Average | Top Quartile |
|---|---|---|---|
| Equipment Availability | Below 90 percent | 92 to 95 percent | 97 percent or higher |
| Maintenance Cost Per Vehicle | Above 18000 dollars | 14000 to 18000 dollars | 12400 dollars or lower |
| Fuel Budget Forecast Error | Above 25 percent | 10 to 25 percent | Below 5 percent |
| Unplanned Repair Premium | Above 2.8x scheduled cost | 2.1 to 2.8x | Under 1.5x scheduled cost |
The fleets that consistently outperform their peers are rarely spending less. They are spending against a real benchmark instead of an internal assumption that has gone unchallenged for years. Once equipment availability, maintenance cost per vehicle, cost per mile, and repair premiums are compared against actual industry data rather than last year's budget, the gaps tend to reveal themselves quickly, and so does the dollar value of closing them.
Equipment availability, maintenance cost per vehicle, and cost per mile all mean more once measured against real industry benchmarks instead of internal assumptions. FleetRabbit gives you that comparison automatically. Start your free trial today, no credit card required.







