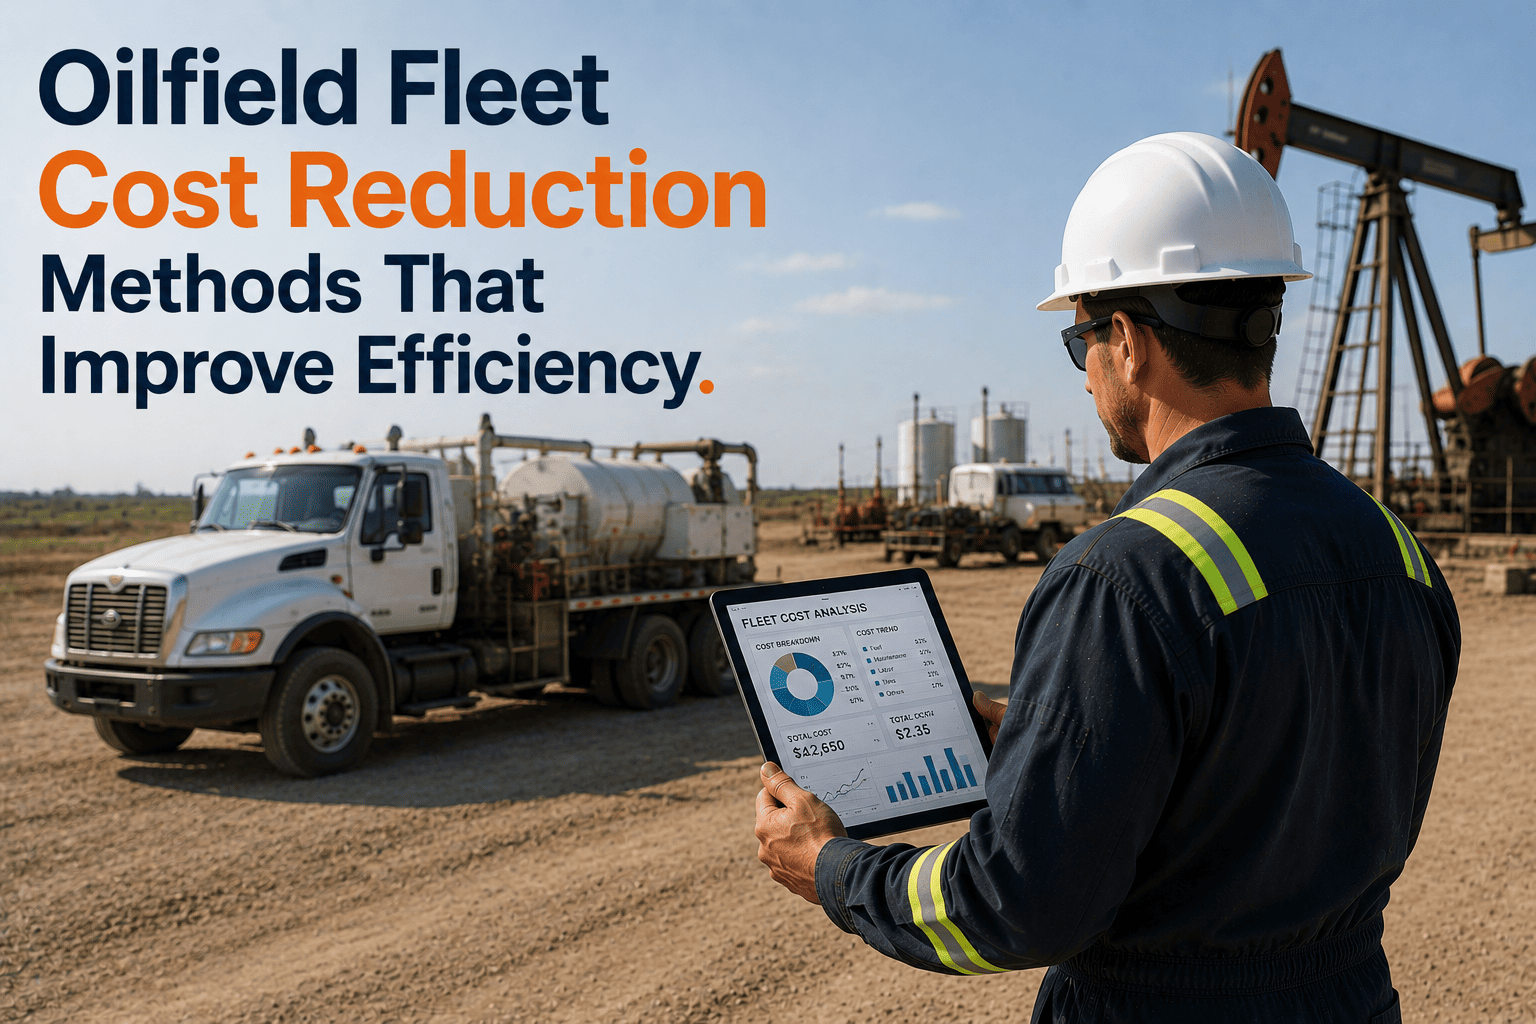
Oilfield fleet operating costs represent one of the most controllable expense categories available to basin operators — yet systematic cost reduction remains elusive for the majority of companies managing crude haul, well service, and produced water disposal fleets because the financial data needed to drive intervention arrives weeks after the costs have already accumulated, in formats that reveal totals without the asset-level attribution necessary to target corrective action. A 200-vehicle oilfield service fleet spending $7.2 million annually on combined fuel, maintenance, overtime, and administrative costs carries $1.8 to $2.5 million in addressable operational waste that standard monthly P&L reporting cannot identify, locate, or eliminate without real-time telematics data, predictive maintenance analytics, and automated compliance workflows replacing the manual processes generating a significant portion of that overhead. The financial mathematics of oilfield fleet cost reduction are compelling precisely because the platform investment required to generate actionable data is negligible relative to the savings it enables — FleetRabbit's integrated fleet management platform costs $3 per vehicle per month, meaning a 200-vehicle oilfield fleet invests $7,200 annually to access analytics infrastructure that documented deployments demonstrate recovers that investment within 3 to 5 operational days and generates $1.5 to $2.8 million in annual cost reduction through systematic intervention across six distinct expenditure categories. Fleet managers and financial executives who understand which cost categories are mechanically addressable through data-driven intervention — and what specific platform capabilities translate to measurable reductions in each — are positioned to build the financial case for digital fleet management adoption that their organization's capital allocation process requires. Schedule a cost reduction assessment to quantify savings potential for your specific oilfield fleet.
Six Cost Reduction Methods Delivering 22-31% Operational Savings for Oilfield Fleet Operators
Data-driven fleet cost reduction in oilfield operations requires targeting the six expenditure categories where real-time visibility and automated analytics enable systematic intervention — transforming financial overruns from inevitable operational characteristics into identifiable, addressable, and measurable problems that platform technology eliminates within weeks of deployment.
Data-Driven Cost Reduction Across Every Major Oilfield Fleet Expenditure Category
Each cost reduction method maps to a specific FleetRabbit platform capability — connecting the financial opportunity to the operational intervention mechanism that converts potential savings into documented results.
Fuel Cost Reduction Through Idle Monitoring, Route Optimization, and Theft Prevention
Fuel represents 35-45% of total oilfield fleet operational expenditure — the largest single cost category and the one with the highest concentration of systematic waste that aggregate reporting cannot isolate. Idle accumulation at remote wellsite staging areas runs 40-52% of engine hours during winter operations when cab heating, hydraulic system warmup, and driver break behavior combine without real-time monitoring constraints. Route inefficiency across unmapped lease road networks adds 10-16% excess mileage from driver-selected paths that no commercial navigation tool addresses because lease road infrastructure does not exist in standard mapping databases. Unauthorised fuel removal from unstaffed satellite storage facilities generates 6-11% additional waste that monthly reconciliation discovers weeks after recurring events have already compounded.
In-cab idle alerts at configurable per-vehicle-class thresholds create driver awareness at the moment of each excessive idle event — producing behavior change that generic awareness training consistently fails to achieve. GPS route history on satellite-connected vehicles at all lease road locations provides the first fleet-wide view of actual delivery paths, enabling dispatcher-guided route correction that reduces transit mileage 11-16% within 5 months. Tank telemetry monitoring at all bulk fuel storage locations detects unauthorised drain events within 7-8 minutes of onset — enabling management notification and law enforcement response before events conclude while deterrence reduces attempt frequency within 90 days of monitoring activation.
Maintenance Cost Reduction Through Predictive Health Monitoring
Unplanned maintenance events cost 2.1-2.8 times equivalent scheduled servicing due to emergency mobilisation, expedited parts procurement, extended downtime from parts unavailability, and cascading damage when primary component failures progress to adjacent system damage before field breakdown forces attention. Oilfield heavy equipment operating in high-stress conditions generates disproportionate unplanned maintenance frequency — frac pumps, crude tanker hydraulic systems, and vacuum truck power units developing failures that sensor-based monitoring identifies weeks before mechanical symptoms emerge during field operations where emergency response capability is severely limited.
Continuous equipment health monitoring tracks engine parameters, hydraulic pressures, fluid analysis trends, and operating hour accumulation against component-specific degradation curves — generating maintenance alerts 2-4 weeks before failure probability reaches critical thresholds. Oil analysis laboratory integration automatically imports wear metal and contamination results against equipment-specific benchmarks, triggering intervention workflows when trends indicate developing bearing, gear, or seal failures requiring targeted replacement rather than component guesswork. Predictive intervention scheduling coordinates planned downtime windows with parts procurement, minimising the revenue-generating operational disruption that emergency repairs produce without warning.
Overtime Cost Reduction Through GPS-Connected Dispatch and Scheduling Optimization
Overtime in oilfield fleet operations accumulates through three mechanisms that aggregate payroll data reveals but cannot address without real-time visibility: equipment retrieval cycles where crews return to staging yards for assets that GPS-connected dispatch could have pre-positioned between sequential jobs; wrong-location dispatches from manual coordinate entry errors that send service trucks to incorrect well pad locations and extend shift duration by 40-60 minutes per incident; and scheduling inefficiency where dispatchers lacking live asset positions commit to job assignments that require overtime completion because they cannot identify available resources from earlier completions that GPS shows are already nearby.
Live asset position visibility enables dispatchers to pre-position equipment between sequential jobs within the same operational corridor, redirect in-transit vehicles to emerging assignments without staging yard returns, and confirm actual vehicle availability against shift schedules before committing to job assignments. GPS-confirmed dispatch coordinates eliminate coordinate entry errors entirely, removing the systematic wrong-location dispatch pattern that accounts for 40-60 minutes of overtime accumulation per incident across 8-12 monthly events in typical oilfield service operations. Scheduling optimization reports identify systematic overtime patterns — specific routes, time windows, or crew combinations — generating structural changes beyond individual dispatch decisions.
Administrative Cost Reduction Through Automated Compliance and Reporting Workflows
Manual fleet administration consumes management and administrative staff time across every compliance obligation — paper driver vehicle inspection reports collected from field locations, hours-of-service logbook processing with 3-4 day review lag, monthly fuel card reconciliation requiring 30-40 hours of finance staff time across 100-200 vehicle accounts, driver certification expiration tracking via spreadsheet, and manual safety incident report compilation for regulatory submission. Aggregate time consumption for these workflows typically runs 12-18 FTE hours daily for a 200-vehicle oilfield fleet — representing $280,000-$420,000 in annual administrative labour cost with no value creation beyond regulatory obligation satisfaction and the risk of compliance gaps when manual tracking fails.
Digital DVIR mobile submission, automated GPS route logging, fuel card API reconciliation generating real-time cross-reference against telematics consumption data, driver certification database with automated expiration escalation, and one-click regulatory report generation replace the paper-dependent processes consuming administrative capacity. Monthly fuel reconciliation reducing from 35 hours to 3 hours represents a direct 91% time reduction on that single workflow — and each equivalent automation across other compliance processes compounds the total administrative capacity recovered for operational analysis and management work that creates value rather than satisfying obligation.
Asset Utilization Cost Reduction Through Data-Driven Redeployment and Right-Sizing
Asset underutilization is the most financially significant cost category that standard fleet management reporting fails to surface — because vehicles sitting idle at staging yards while other sites scramble for capacity do not generate visible cost events that appear in maintenance or fuel records. Static asset assignment practices that fail to adapt to shifting production demands, project completion cycles, and seasonal operational variations create systematic utilization imbalances where some vehicles operate at 90%+ while others average 45-55% utilization — carrying full ownership, insurance, and maintenance cost for assets that could cover two to three operational sites with appropriate redeployment visibility.
Real-time utilization dashboards track actual deployment hours versus available hours by asset, operational site, and time period — identifying chronic underperformers with precision that enables redeployment decisions grounded in verified operational data rather than subjective manager assessments. Lifecycle cost analytics compare total cost of ownership by vehicle, identifying assets where accumulated maintenance cost escalation has crossed the economic replacement threshold that intuition-based retention decisions chronically overshoot. Fleet right-sizing analysis quantifies the operational capacity maintained while reducing fleet size, enabling capital reallocation from owned fleet overhead to revenue-generating operational investment.
Insurance Premium Reduction Through Documented Safety Program Evidence
Oilfield fleet insurance premiums are set against risk profiles that underwriters calculate from historical claim frequency and severity data — and in the absence of documented behavioral monitoring programs with verifiable safety improvement trajectories, underwriters default to category-level risk pricing that does not credit the safety investments operators have made through training programs and safety culture initiatives that lack quantified outcome data. Operators who cannot demonstrate verified incident rate reduction, behavioral score improvement trends, and systematic safety management program documentation are leaving 12-18% of insurance premium savings unrealised each renewal cycle.
Continuous driver behavioral scoring, digital incident documentation with telematics data attachment, corrective action tracking from assignment through verified closeout, and period-over-period safety performance trend reports generate the verified documentation package that insurance renewal negotiations require to support premium reduction discussions grounded in objective risk profile improvement evidence. Fleet managers provide underwriters with behavioral score distribution improvements, incident frequency reduction percentages, and corrective action program records demonstrating systematic safety management maturity — replacing anecdotal safety culture assertions with quantified, platform-verified performance data.
From Cost Visibility Gap to Systematic Reduction — The FleetRabbit Deployment Sequence
216-Vehicle Crude Haul and Well Services Operator: $2.34M Annual Cost Reduction Through Systematic Six-Category Intervention
West Texas crude oil midstream and well services company deployed FleetRabbit across 216 mixed-fleet vehicles following a 30-vehicle pilot that documented $58,000 in cost savings within 46 days — providing the financial evidence that converted deployment from budget discussion to financial decision. Full fleet deployment achieved 29% total operational cost reduction within 14 months across all six expenditure categories: $810,000 fuel savings, $572,000 maintenance cost reduction, $428,000 overtime elimination, $296,000 administrative overhead reduction, $168,000 asset utilization improvement, and $66,000 insurance premium reduction. Platform investment: $7,776 annually — total cost recovery in 1.2 operational days.
How Systematic Fleet Cost Reduction Serves Every Level of Oilfield Organizational Leadership
Asset-Level Cost Attribution Replacing Aggregate Monthly Summaries
Real-time per-vehicle cost dashboards identify which specific assets, drivers, and operational areas are generating cost overruns the moment they develop — enabling targeted intervention before monthly reports arrive weeks after costs have accumulated. Fleet managers shift from reactive financial damage assessment to proactive cost management grounded in current operational data.
Operational Continuity Through Predictive Cost Prevention
Predictive maintenance preventing unexpected field equipment failures, GPS dispatch eliminating crew overtime accumulation, and utilization analytics enabling proactive capacity management together protect the operational reliability that customer production commitments require. Cost reduction and operational performance improvement are the same outcome viewed from financial and service delivery perspectives simultaneously.
Verified Cost Attribution Supporting Capital Allocation Decisions
Platform-generated cost data provides the asset-level attribution accuracy that project costing, budget variance analysis, and fleet capital allocation decisions require. Fleet replacement timing, capacity expansion justification, and maintenance reserve adequacy can be evaluated against verified operational performance data rather than estimated cost models that systematically underestimate actual vehicle lifecycle cost trajectories.
Fleet Cost as Strategic Competitive Advantage in Basin Service Markets
Operators achieving 22-31% fleet operational cost reduction carry structural competitive advantages in basin service market pricing negotiations — lower cost structures enable service rate flexibility that higher-cost competitors cannot match without margin compression. HSE qualification improvements from systematic safety monitoring programs additionally expand the client base accessible to documented safety performers in increasingly qualification-driven oilfield service contracting environments.
Deploy the Integrated Analytics Platform That Converts Cost Visibility Into Systematic, Documented, Compounding Fleet Cost Reduction
FleetRabbit's oilfield fleet cost reduction platform delivers simultaneous intervention across fuel waste through idle monitoring, route analytics, and tank telemetry; maintenance costs through predictive health monitoring and oil analysis integration; overtime through GPS dispatch and scheduling optimization; administrative overhead through automated compliance workflows; asset underutilization through real-time utilization analytics; and insurance premiums through verified safety program documentation — achieving 22-31% total operational cost reduction from a $3 per vehicle per month investment that pays back within 3-5 operational days and compounds financial returns as operational habits embed across your fleet population.







