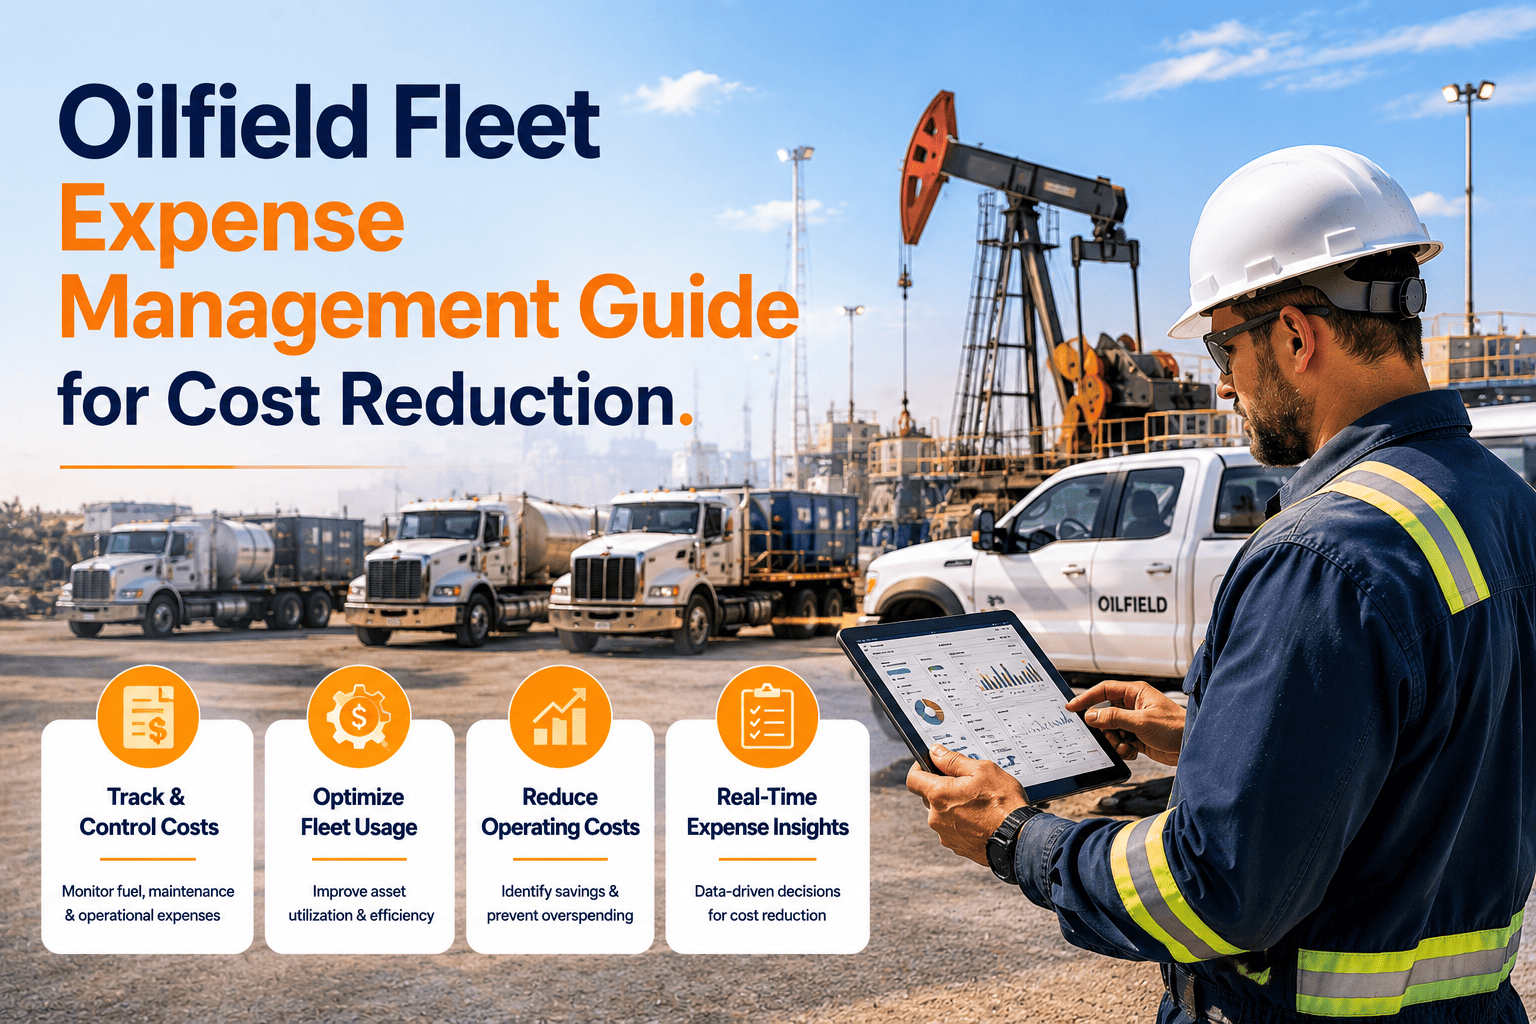
Oilfield fleet expense management separates high-performing operators from those hemorrhaging capital through untracked fuel consumption, deferred maintenance escalating into emergency repair costs, unauthorized vehicle usage, and administrative overhead consuming management bandwidth without delivering operational insight. For a 100-vehicle oilfield fleet, the difference between systematic expense management and reactive cost tracking amounts to $800,000–$1.4 million annually in recoverable losses — fuel waste from excessive idling and route inefficiency, maintenance cost overruns from missed preventive intervals, insurance premium inflation from poor driver safety records, and compliance penalties from incomplete documentation. FleetRabbit's integrated expense management platform gives fleet managers and executives the real-time cost visibility, automated tracking, and data-driven budgeting capabilities to eliminate these losses systematically. Schedule a consultation to quantify your fleet's expense reduction potential.
OILFIELD FLEET COST MANAGEMENT
Oilfield Fleet Expense Management Guide: Systematic Cost Reduction for Oil and Gas Operations
FleetRabbit transforms oilfield fleet expense management from reactive cost reporting into proactive financial control — delivering real-time visibility into fuel consumption, maintenance costs, compliance expenses, and administrative overhead with automated tracking that prevents cost overruns before they compound.
Where Oilfield Fleet Costs Escape Without Systematic Management
Fuel Waste
$180K–$340K
Annual waste per 100 vehicles from idle time and inefficient routing
Emergency Repairs
$4,200–$8,500
Average cost per unplanned breakdown versus scheduled maintenance
Admin Burden
$62K–$104K
Annual manual compliance and reporting labor — zero operational value
Underutilized Assets
8–14%
Fleet capacity carried unnecessarily through poor utilization data
Eliminate these costs with FleetRabbit — free trial
FIVE EXPENSE MANAGEMENT CATEGORIES
Complete Oilfield Fleet Expense Framework: Where Every Dollar Goes and How to Control It
Effective oilfield fleet expense management requires visibility across five cost categories simultaneously. FleetRabbit tracks all five in real time — giving managers the cross-category view that reveals true cost drivers and intervention priorities.
01
Fuel and Consumption Costs
30–40% of total fleet operating expense
02
Maintenance and Repair
25–35% — preventive vs emergency split critical
03
Asset Lifecycle and Depreciation
15–22% — replacement timing determines total cost
04
Compliance and Administrative
8–14% — largely eliminable through automation
05
Insurance and Risk
10–16% — driver safety data drives premium reduction
CATEGORY-BY-CATEGORY EXPENSE MANAGEMENT
How FleetRabbit Controls Each Cost Category Across Oilfield Operations
Cost Escalation Drivers
Fuel represents 30–40% of total oilfield fleet operating expense — and without real-time consumption visibility, three cost drivers operate invisibly. Excessive idling at remote pad sites and during field wait times consumes 15–25% of total fuel without productive output. Inefficient routing adds 8–14% unnecessary mileage through suboptimal path selection. Unauthorized after-hours usage and fuel card misuse consumes 8–12% of annual fuel budgets at fleets without systematic controls. Monthly credit card statements reveal these losses weeks after they occur — too late for intervention.
FleetRabbit Fuel Expense Solution
Real-time idle monitoring pushes threshold alerts to drivers and managers the moment idling exceeds configurable limits — preventing waste rather than reporting it. GPS-derived consumption tracking by vehicle, driver, and route replaces estimated monthly summaries with daily actuals. Geofencing and after-hours alerts detect unauthorized usage as it occurs. Weekly fuel efficiency rankings identify the highest-cost drivers for targeted coaching. Automated fuel expense reports by cost center, project, or customer eliminate manual compilation.
Documented Cost Reduction
12–18%
Total fuel consumption reduction through idle management and route optimization
$160K–$280K
Annual savings for 100-vehicle oilfield operation
25–35%
Driver behavior improvement within 6 months of scorecard deployment
Cost Escalation Drivers
Maintenance costs split between planned preventive services averaging $400–$800 per event and emergency repairs averaging $4,200–$8,500 per incident. Fleets managing maintenance through spreadsheets achieve 30–45% preventive maintenance adherence — meaning 55–70% of maintenance occurs reactively at premium cost. Deferred preventive services accelerate component wear, extend repair duration, and trigger cascading failures in remote field locations where emergency response costs multiply. Manual tracking creates systematic interval misses when multiple parameters — mileage, engine hours, calendar cycles — require simultaneous monitoring.
FleetRabbit Maintenance Expense Solution
Multi-parameter automated scheduling tracks mileage, engine hours, and calendar intervals simultaneously — eliminating the single-parameter oversight that spreadsheets create. Preventive maintenance adherence improves from 35–50% to 90–95% through automated work order generation and mobile technician notifications. Emergency repair frequency drops 45–55% as predictive maintenance algorithms detect developing failures 7–21 days before breakdown probability peaks. Maintenance cost per operating hour tracking by vehicle identifies chronic high-cost assets warranting lifecycle replacement before repair investment exceeds economic justification.
Documented Cost Reduction
45–55%
Reduction in emergency repair events versus reactive maintenance baseline
$380K–$620K
Annual maintenance cost savings for 100-vehicle operation
18–28%
Component life extension through consistent preventive interval adherence
Cost Escalation Drivers
Fleet composition decisions without quantitative total cost of ownership data result in retaining aging vehicles beyond economic replacement points — paying $12,000–$18,000 annually in excess maintenance and downtime costs on assets that $45,000 replacement vehicles would eliminate. Underutilized assets sitting idle 40–50% of available hours consume insurance, depreciation, and compliance costs without productive return. Capital allocation decisions based on gut feel rather than utilization and cost data consistently misallocate budget toward low-return asset investments.
FleetRabbit Lifecycle Expense Solution
Total cost of ownership reporting tracks acquisition, maintenance, fuel, insurance, and downtime costs per vehicle — revealing the true economic performance of each asset. Predictive maintenance cost escalation modeling identifies the inflection point where repair investment exceeds replacement value, enabling right-time replacement decisions that minimize lifecycle cost. Utilization analytics expose underperforming assets warranting disposal or redeployment. Scenario analysis tools quantify fleet right-sizing opportunities with financial projections supporting capital allocation decisions by operations executives.
Documented Cost Reduction
10–16%
Fleet size reduction opportunity while maintaining full operational capacity
$280K–$460K
Annual value from fleet composition optimization for 100-vehicle operation
12–18%
Lifecycle cost reduction through data-driven replacement timing decisions
Cost Escalation Drivers
Manual compliance management consumes 12–20 administrative hours weekly collecting paper DVIRs from remote field locations, transcribing data into compliance databases, monitoring driver certification expiration calendars, and assembling audit documentation on demand. This $62,000–$104,000 annual labor cost produces no operational insight — it simply satisfies regulatory obligations with maximum friction. DOT compliance violations from incomplete documentation add $1,000–$5,000 per incident in direct penalties, plus insurance premium increases and CSA score deterioration with compounding multi-year cost consequences.
FleetRabbit Compliance Expense Solution
Digital DVIR mobile submissions replace paper collection workflows with real-time electronic records. Automated driver certification alerts at 30 and 60 days before expiration prevent non-compliant dispatch. One-click compliance report generation eliminates manual data compilation for DOT audits and internal reviews. Complete timestamped digital audit trails satisfy regulatory requirements instantly without document retrieval delays. ELD integration automates Hours of Service compliance eliminating manual logbook vulnerabilities that create violation exposure.
Documented Cost Reduction
75–85%
Administrative time reduction through end-to-end compliance automation
$48K–$88K
Annual administrative labor savings for 100-vehicle oilfield operation
98%+
Inspection completion rate achieved versus 65–75% paper-based baseline
Cost Escalation Drivers
Fleet insurance premiums correlate directly with driver safety records, accident frequency, vehicle maintenance history, and compliance documentation quality. Fleets without telematics-based safety programs experience 40–60% higher accident frequency through unmonitored speeding, harsh driving patterns, and fatigue-related incidents. Each reportable accident triggers immediate premium increases affecting the entire fleet for 3–5 years, compounding the financial impact well beyond direct repair and liability costs. Poor CSA scores from compliance violations further inflate premiums while limiting operating authority in certain jurisdictions.
FleetRabbit Risk Expense Solution
Driver safety scorecards tracking speeding frequency, harsh acceleration, hard braking, and Hours of Service compliance provide the objective performance data that insurers reward with premium reductions. Accident reconstruction data from GPS location history and accelerometer records supports liability defense and fraud prevention reducing claims costs. Proactive safety coaching programs targeting specific behavior deficiencies achieve 40–60% speeding incident reduction within 6 months. Complete compliance documentation creates the clean safety record that drives premium negotiations with carriers seeking well-managed fleet accounts.
Documented Cost Reduction
8–15%
Insurance premium reduction through documented safety program implementation
15–25%
Accident frequency reduction through driver scorecard and coaching programs
40–60%
Speeding incident decrease within 6 months of safety monitoring deployment
Recover $800K–$1.4M in avoidable annual fleet costs
FleetRabbit's integrated expense management platform addresses all five cost categories simultaneously at $3 per vehicle per month — delivering positive ROI within the first billing cycle for most oilfield operations.
EXPENSE MANAGEMENT CASE STUDY
180-Vehicle Permian Basin Operator: $1.64M Annual Cost Recovery Through FleetRabbit
Mid-size E&P operator — drilling and completion services across West Texas and Southeast New Mexico
Fleet: 180 mixed assets including service trucks, pickups, trailers, and specialty equipment
FleetRabbit Investment: $6,480 annually — $3 per vehicle per month, all features included
Fuel Expense Reduction
Idle time reduced 32% through real-time monitoring program. Route optimization eliminated 8% unnecessary mileage. Combined fuel consumption decreased 12% versus prior year baseline across entire 180-vehicle fleet.
$394,000 annual
Maintenance Cost Optimization
PM adherence improved from 42% to 91% through automated scheduling. Emergency repair frequency decreased 48%. Component life extended 22% through consistent interval compliance across all vehicle classes.
$271,000 annual
Downtime Cost Elimination
Unplanned downtime decreased from 5.2% to 3.4% through predictive maintenance intervention. Revenue-generating equipment availability improved enabling completion of previously deferred job commitments.
$447,000 annual
Asset Utilization Improvement
Fleet utilization increased from 64% to 76%. Data-driven redeployment eliminated 22 underutilized vehicles from active fleet while maintaining full operational capacity — eliminating carrying costs on idle assets.
$528,000 annual
Total Annual Savings: $1,640,000
Platform Cost: $6,480/year
ROI: 25,209%
Payback: 1.4 days
Every day without systematic fleet expense management is another day of recoverable costs accumulating across fuel waste, deferred maintenance, idle assets, and administrative overhead. At $3 per vehicle monthly, FleetRabbit's cost recovery typically exceeds the platform investment within the first week of operation.
Book a demo to model your specific fleet's expense reduction opportunity.
90-DAY EXPENSE REDUCTION ROADMAP
From Cost Visibility Gaps to Systematic Expense Control in 90 Days
DAYS 1–30
Cost Baseline and Immediate Savings Capture
Platform deployment establishing real-time cost baseline across all five expense categories
Idle reduction campaign launch with driver threshold alerts generating immediate fuel savings
Automated PM scheduling deployment eliminating manual tracking and interval miss costs
Utilization analytics identifying top 10 underperforming assets for redeployment or disposal evaluation
Expected Impact: 5–8% total expense reduction through initial quick-win interventions
DAYS 31–60
Predictive Programs and Behavioral Cost Reduction
Predictive maintenance alerts generating proactive repair scheduling at planned-cost versus emergency-cost rates
Driver scorecard program activating safety and fuel behavior improvement through performance visibility
Compliance automation reducing administrative expense 60–75% versus manual process baseline
Cost allocation accuracy deployment enabling project-level profitability visibility and billing improvement
Cumulative Impact: 12–16% total expense reduction from established baseline
DAYS 61–90
Strategic Cost Optimization and Budget Intelligence
Fleet composition analysis with lifecycle cost modeling guiding replacement timing and capital allocation
Insurance premium reduction initiative using driver safety scorecard data for carrier negotiation
Predictive expense forecasting framework replacing historical-only budget methodology
Exception-based cost management protocols focusing management attention on material variances
Mature State Impact: 18–24% sustained expense reduction delivering $1.2–$2.4M annually for 100-vehicle fleets
DEPLOY SYSTEMATIC FLEET EXPENSE MANAGEMENT
Eliminate $800K–$1.4M in Recoverable Annual Fleet Costs Through Data-Driven Expense Management
FleetRabbit's integrated expense management platform delivers real-time cost visibility across fuel consumption, maintenance expenses, asset lifecycle costs, compliance overhead, and insurance risk — with automated tracking, predictive analytics, and executive reporting that transforms oilfield fleet expense management from reactive reporting into proactive financial control. At $3 per vehicle per month, the platform investment is recovered within days through fuel savings alone.
5 expense categories tracked
Real-time cost dashboards
Predictive maintenance savings
Automated compliance reporting
$3/vehicle all-inclusive
18–24% cost reduction
May 14, 2026
By David
All Posts