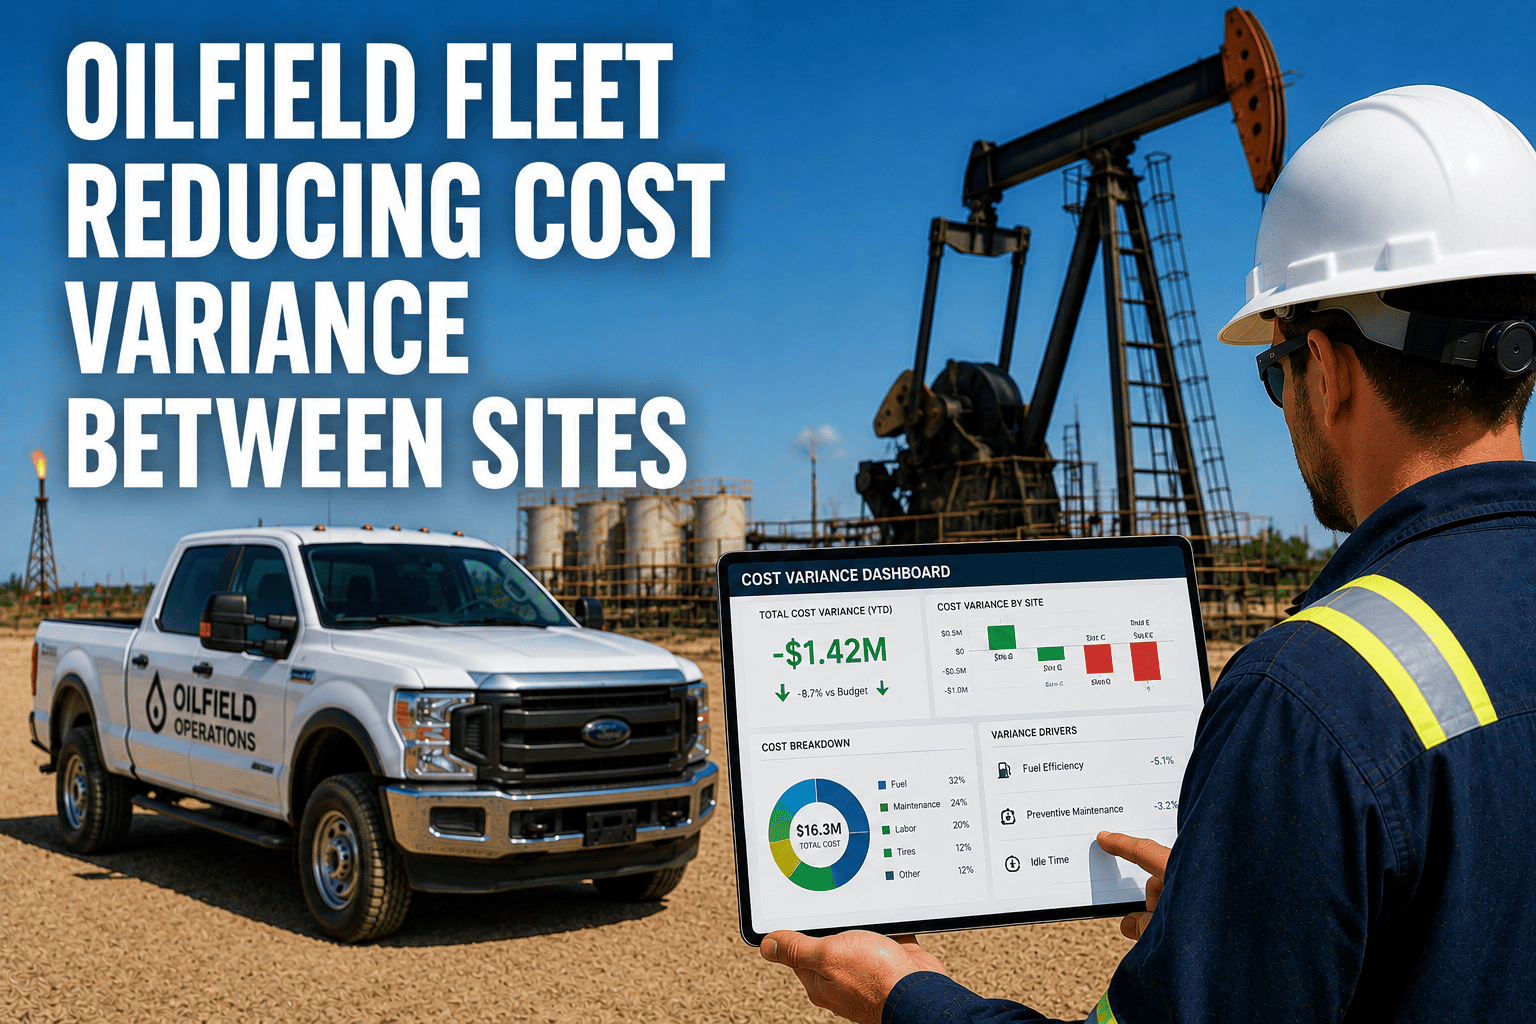
Managing an oilfield fleet across multiple remote sites presents a massive financial challenge: cost variance. When one yard operates efficiently at 1.20 dollars per mile while another bleeds money at 2.50 dollars per mile, your overall profitability suffers. Identifying these expensive outliers requires comparing maintenance, fuel, and utilization data across all operating locations. FleetRabbit provides the centralized platform to benchmark your sites and eliminate unnecessary spending. You can sign up for FleetRabbit to analyze your fleet today, or book a demo to see our cost comparison tools.
Cost variance between oilfield yards often reaches 20 to 40 percent due to differing maintenance cultures and fuel inefficiencies. A 50-vehicle fleet with unmanaged site variance can lose 150,000 to 300,000 dollars annually. Centralized benchmarking exposes these costly outliers, allowing managers to standardize operations and recover lost profits.
Understanding Multi-Site Cost Variance
Multi-site cost variance occurs when identical assets, performing identical jobs, cost significantly different amounts to operate depending on their geographic location or assigned yard. In the oilfield industry, it is common for a truck operating out of Yard A to cost 30 percent more per mile than the exact same truck operating out of Yard B. This variance is rarely due to actual market conditions; it is almost always a result of operational inefficiencies, poor local management, and siloed data. Understanding and reducing this variance is the key to maximizing fleet-wide profitability.
The Problem with Siloed Yard Data
When each oilfield yard operates as an independent silo, headquarters is blind to localized inefficiencies. Yard managers track their own fuel and maintenance on local spreadsheets, making true comparison impossible. A yard manager might report a 90 percent uptime rate, but hide the fact that they achieved it by skipping oil changes and burning through tires. Siloed data prevents the cross-pollination of best practices, allowing expensive outliers to exist undetected for years, draining capital that could be used for fleet expansion.
Identifying the Expensive Outliers
To identify expensive outliers, you must normalize your data. You cannot simply compare total fuel spend, as one yard might run more trucks. You must compare cost-per-mile, cost-per-hour, and maintenance cost-per-asset across all sites. When you plot these metrics on a graph, the outliers become obvious. The yards that fall above the fleet average are the ones draining your operational budget. To find these outliers, you can sign up for FleetRabbit to analyze your fleet today, or book a demo to see our cost comparison tools.
FleetRabbit consolidates fuel, maintenance, and utilization data from all your oilfield yards into a single dashboard. Instantly spot which sites are overspending and standardize your operations to match your most efficient yard. Start your free trial today to reclaim lost profits.
The Financial Impact of Ignoring Cost Differences
Ignoring multi-site cost variance is equivalent to setting fire to a portion of your operating budget every month. The financial impact is compounding. If one yard costs 0.50 dollars more per mile to operate, and runs 100 trucks at 10,000 miles per month each, that single yard is bleeding 50,000 dollars a month, or 600,000 dollars a year. This hidden tax on your operations limits your ability to win new contracts, because you are forced to bid using your average cost, which is artificially inflated by the expensive outliers.
| Cost Category | Typical Site Variance | Root Cause | FleetRabbit Solution |
|---|---|---|---|
| Fuel Efficiency | 15 to 25 percent | Excessive idle time, poor route planning, and fuel siphoning | Cross-site idle tracking and fuel card integration |
| Maintenance Spend | 20 to 40 percent | Reactive repairs, lack of preventative schedule enforcement | Standardized PM schedules and automated repair approvals |
| Asset Utilization | 10 to 30 percent | Overstaffed yards, hoarding backup trucks, poor dispatch | Real-time yard inventory and engine hour benchmarking |
| Labor & Overtime | 15 to 20 percent | Poor HOS planning and unbalanced workloads across sites | Centralized dispatch and automated driver scheduling |
| Tire Replacement | 25 to 50 percent | Unmonitored pressure levels and aggressive driving behaviors | Tire pressure monitoring and driver scorecards |
Strategies to Standardize Fleet Costs
Standardizing fleet costs across multiple oilfield sites requires a centralized approach to data management. The first strategy is establishing a universal benchmark. Once you identify your most efficient yard, you must analyze their practices and enforce those same practices across all other sites. This means standardizing preventative maintenance schedules, fueling protocols, and utilization metrics. If Yard A achieves 90 percent uptime with 10 percent fuel waste, Yard B must be held to the exact same standard. This standardization eliminates the local "flavor" of management that often leads to cost overruns.
Centralized Benchmarking
Centralized benchmarking means headquarters has a real-time view of every yard's performance. Instead of waiting for end-of-month reports, managers can see live cost-per-mile data. If a specific yard suddenly spikes in fuel consumption, an alert is triggered, and the issue is investigated immediately. Centralized benchmarking forces local managers to compete, driving down costs across the board as each yard strives to hit the fleet-wide standard.
Unified Maintenance Protocols
Unified maintenance protocols are essential for cost standardization. A truck at Yard A should receive the exact same preventative maintenance intervals as a truck at Yard B. If Yard B is deferring maintenance to save money in the short term, FleetRabbit's system will flag it, showing the inevitable increase in catastrophic breakdowns later. This prevents local managers from gaming their numbers. To enforce these protocols, you can sign up for FleetRabbit to analyze your fleet today, or book a demo to see our cost comparison tools.
How FleetRabbit Exposes Cost Outliers
Modern fleet cost management requires technology that connects every asset to a central database. FleetRabbit's integrated platform combines fuel card data, GPS tracking, and maintenance records into a single dashboard. The system automatically calculates cost-per-mile and cost-per-hour for every asset, grouped by site. This allows managers to instantly see which yards are performing above or below the fleet average. By exposing these costly outliers, FleetRabbit provides the exact data needed to correct operational inefficiencies and recover lost capital.
Real-Time Site Comparisons
Real-time site comparisons eliminate the excuses. Local managers can no longer blame their high costs on "tough terrain" or "bad roads" when the data shows identical routes being run cheaper by other yards. The FleetRabbit dashboard color-codes site performance, making it visually obvious which yards are dragging down the bottom line. This transparency forces accountability and drives immediate corrective action.
Asset Utilization Tracking
One of the biggest drivers of cost variance is underutilization. A yard that hoards 15 backup trucks but only uses 5 of them is carrying massive fixed costs. FleetRabbit tracks engine hours and movement for every asset, exposing "ghost assets" that sit idle for weeks. By redistributing these underutilized assets to busier sites, or selling them, fleets instantly reduce their cost-per-mile metric. This level of tracking is impossible with paper logs and manual spreadsheets.
Key Takeaways for Cost Control
Reducing cost variance between oilfield sites is the most effective way to increase profitability without winning new contracts. A 30 percent variance in maintenance and fuel costs is not a market reality; it is an operational failure. Fleets that allow yards to operate in silos are leaving hundreds of thousands of dollars on the table. A centralized, data-driven approach to cost comparison is the only way to expose and eliminate expensive outliers.
Implementing a comprehensive benchmarking system reduces cost variance by up to 30 percent and recovers 100,000 to 300,000 dollars annually for typical fleets. The return on investment is immediate, not just in recovered capital, but in standardized operations, improved accountability, and extended asset lifecycles. Oilfield operators demand efficient contractors, and FleetRabbit provides the exact data needed to deliver maximum efficiency.
The path forward is clear. Evaluate your current cost-per-mile across all your sites and ask if you can identify your most expensive yard right now. If you are relying on end-of-month spreadsheets, you are losing money. Fleet managers who address site variance systematically protect their profitability and operational reliability. You can sign up for FleetRabbit to analyze your fleet today, or book a demo to see our cost comparison tools.
Frequently Asked Questions About Cost Variance
Every day you ignore cost variance between your oilfield sites is a day you leave money on the table. FleetRabbit exposes your expensive outliers and standardizes your operations, recovering hundreds of thousands in lost capital. See a 30 percent reduction in site variance within weeks. Start your free trial today with no credit card required.







