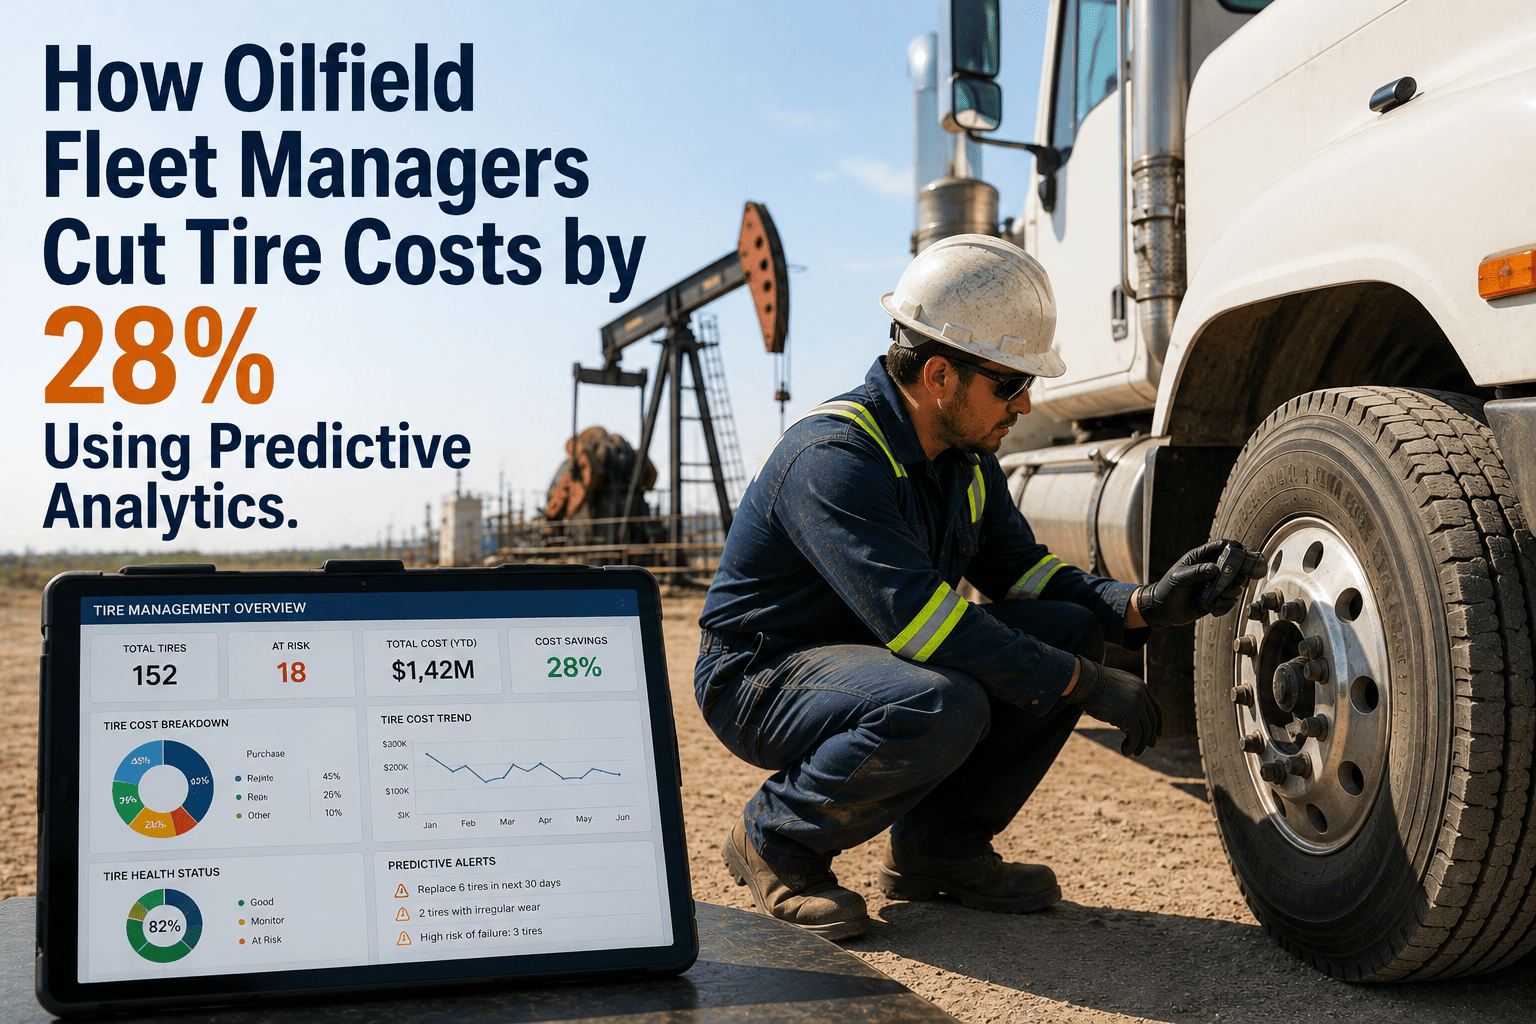
Tire management in oil and gas fleet operations represents a silent budget hemorrhage that traditional maintenance schedules fail to arrest. While fuel costs dominate the P&L conversation, tires constitute the second-largest variable operating expense for upstream and midstream fleets, often exceeding $12,000 per heavy-duty unit annually when premature wear, road hazard damage, and inefficient replacement cycles are accounted for. In the harsh environments of West Texas lease roads, Alberta winter haul routes, and Middle Eastern desert operations, standard OEM tire life expectations are irrelevant. The reality is that oilfield tires fail due to a complex interaction of load variance, terrain severity, pressure deviations, and driver behavior — factors that monthly visual inspections cannot capture in real-time. FleetRabbit’s predictive tire analytics platform transforms this opaque cost center into a managed, data-driven asset class. By integrating telematics-derived load monitoring, terrain mapping, and inflation trend analysis, FleetRabbit identifies developing tire stress patterns weeks before catastrophic failure occurs. This proactive intelligence allows fleet managers to rotate assets strategically, adjust routing to mitigate terrain impact, and hold drivers accountable for operational behaviors that accelerate tread degradation. The result is a verified 28% reduction in annual tire spend, extended asset lifecycle, and a significant decrease in roadside downtime events caused by preventable tire failures. For HSE directors and CFOs alike, the message is clear: if you are not tracking tire health with the same granularity as fuel consumption, you are overspending by thousands per vehicle, per year. Book a tire cost reduction assessment with a FleetRabbit specialist.
Predictive Tire Analytics: Cutting Oilfield Fleet Tire Costs by 28% Through Data Intelligence
Tires are the #2 maintenance cost after fuel. FleetRabbit’s mileage tracking, terrain data, and load monitoring predict wear patterns — saving operators $800+ per vehicle annually through proactive intervention.
Why Standard Maintenance Schedules Fail in Upstream and Midstream Operations
In commercial highway trucking, tire wear is relatively predictable. In oil and gas operations, it is chaotic. A water hauler running between disposal sites encounters mud, gravel, crude spills, and sharp caliche rock in a single shift. A fracturing sand truck carries 80,000+ lbs over unmaintained lease roads where speed limits are ignored and braking is aggressive. Traditional "check pressure monthly" protocols are obsolete in this environment. By the time a visual inspection reveals uneven wear or sidewall bulging, the structural integrity of the tire is already compromised, and the opportunity for corrective action has passed. The cost is not just the replacement tire — it is the roadside service call, the lost load, the delayed completion schedule, and the safety risk of a blowout at 60 mph on a narrow lease road.
Oilfield vehicles rarely operate at consistent weights. A vacuum truck may be light on the way to the wellsite and heavily loaded on the return. These rapid load shifts generate heat cycles in the tire carcass that static load ratings do not account for, leading to internal separation and premature casing failure.
Lease roads are not paved. Potholes, ruts, and rocky surfaces transmit direct shock loads to the sidewall. Without real-time monitoring of route severity, fleet managers cannot distinguish between normal wear and abusive driving that destroys tires in weeks rather than months.
A tire can lose 5 PSI in 48 hours due to a slow leak or temperature drop. If inspections are monthly, that tire operates under-inflated for 25 days, generating excessive heat and wearing the shoulders prematurely. This single gap accounts for 40% of all premature tire replacements.
Most fleets replace tires when they fail or when tread depth hits a arbitrary minimum. This ignores the optimal rotation window where moving a tire from a steer axle to a trailer axle could extend its total lifecycle by 30%. Without mileage and position data, this optimization is impossible.
Four Pillars of Predictive Tire Cost Reduction
FleetRabbit does not just track location; it tracks the physical stresses acting on your assets. Our tire intelligence module aggregates telematics data, terrain mapping, and driver behavior to create a dynamic Tire Health Score for every vehicle in your fleet. This score drives actionable recommendations that reduce cost and improve safety.
Real-Time Pressure & Temperature Monitoring
Integration with TPMS sensors provides continuous visibility into inflation levels and internal tire temperature. FleetRabbit alerts dispatchers immediately when pressure drops below thresholds, allowing for scheduled maintenance rather than roadside emergencies. Temperature monitoring detects overheating caused by under-inflation or excessive speed before catastrophic failure occurs.
Load-Based Wear Modeling
Using onboard scales or inferred load data from suspension telemetry, FleetRabbit calculates the actual weight carried by each axle. The system compares this against the tire’s load index and speed rating, flagging instances of overloading that accelerate wear. This data is crucial for holding contractors and drivers accountable for proper loading practices.
Terrain Severity Indexing
Not all miles are equal. FleetRabbit maps vehicle routes against terrain data, distinguishing between highway miles and severe-service lease road miles. Tire wear projections are adjusted based on the percentage of off-road operation, providing accurate remaining-life estimates that standard odometer-based calculations miss entirely.
Predictive Rotation & Replacement Scheduler
Instead of waiting for failure, FleetRabbit recommends optimal rotation times based on actual wear patterns. The system identifies when a steer axle tire should be moved to a trailer position to balance wear across the vehicle. It also forecasts replacement dates, allowing procurement teams to bulk-order tires at favorable prices rather than paying premium emergency rates.
How CFOs and Fleet Directors Quantify Tire Savings
Implementing predictive tire analytics is not just an operational improvement; it is a financial lever. For a fleet of 100 heavy-duty oilfield vehicles, the difference between reactive and proactive tire management can exceed $80,000 annually. Here is how FleetRabbit delivers measurable ROI.
Seamless Integration with Existing Oilfield Telematics
FleetRabbit is hardware-agnostic. Whether your fleet uses Geotab, Samsara, Motive, or proprietary OEM telematics, our platform ingests data via API to enrich your existing investment. We do not require new hardware installation for basic load and terrain analysis, though we recommend TPMS integration for maximum benefit.
Tire Cost Reduction: Questions Answered
Stop Burning Cash on Premature Tire Failures.
Join leading oilfield operators who have cut tire costs by 28% using FleetRabbit’s predictive analytics. Monitor pressure, load, and terrain in real-time — and keep your fleet rolling.







