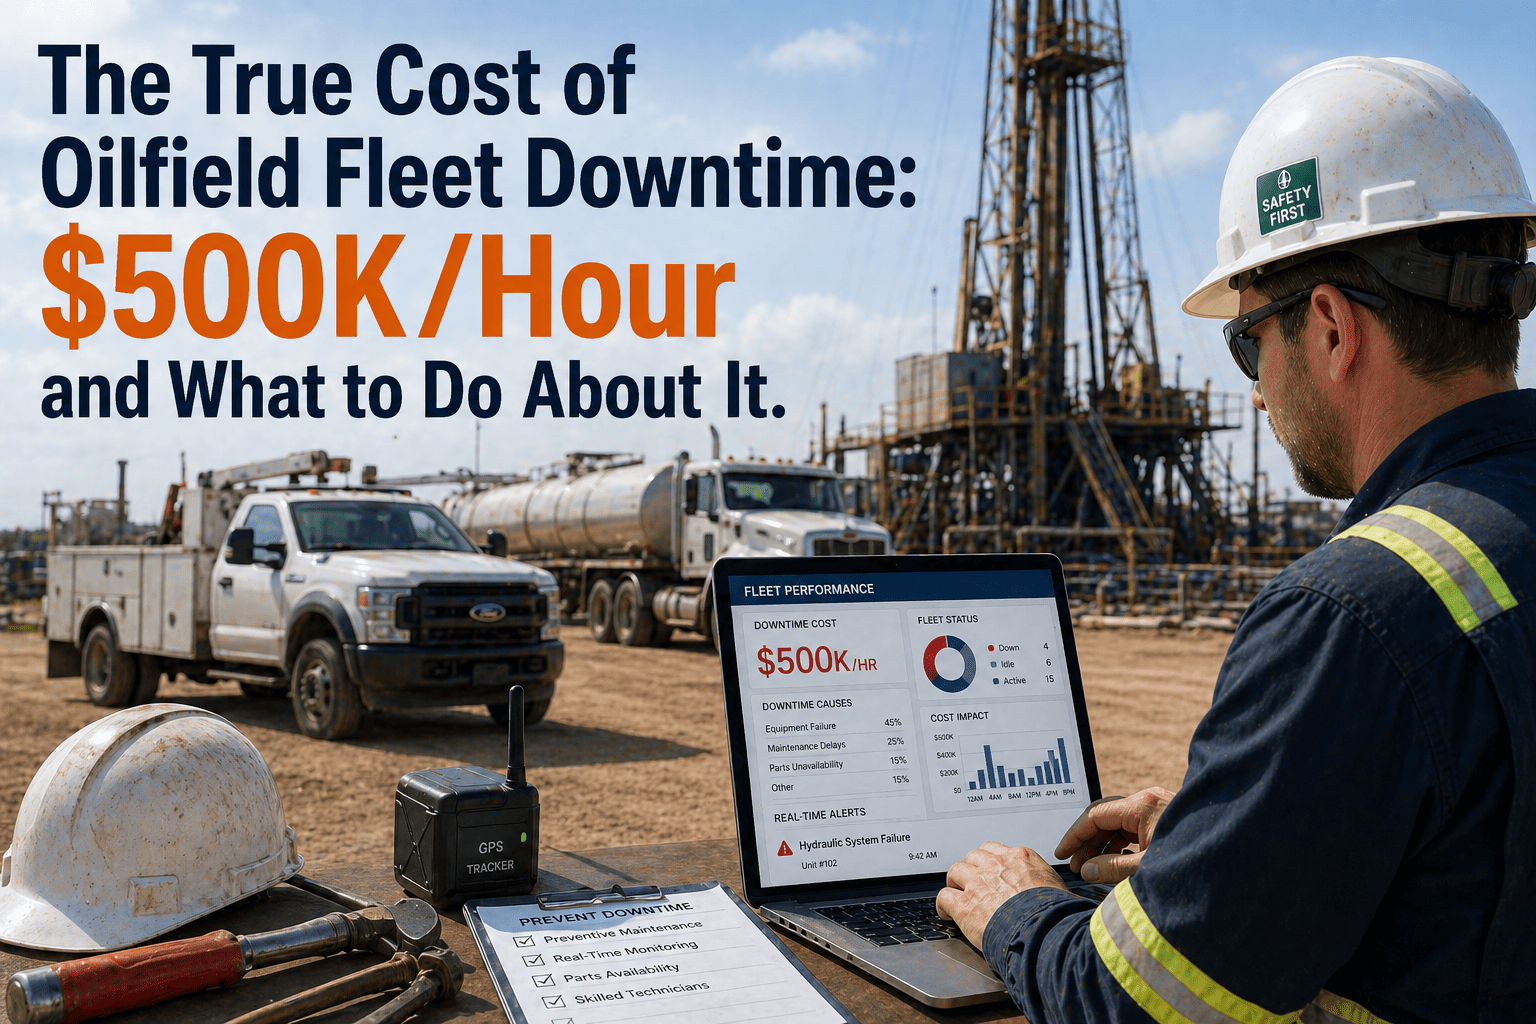
Fleet downtime in oilfield operations does not represent mere operational inconvenience measured in missed delivery schedules or delayed maintenance — it constitutes catastrophic financial hemorrhage where single vehicle breakdown at critical moment cascades into drilling rig standstill costing $500,000 per hour, completion crew demobilization expenses exceeding $180,000, or production shutdown losses accumulating at $850-$1,200 per barrel of deferred output across extended outage duration. A Permian Basin operator experienced this reality when hydraulic failure on single frac sand hauler during critical pumping stage forced complete operation suspension — 14-hour delay waiting replacement truck resulted in $2.8 million direct cost from rig standby charges, crew downtime, equipment rental continuation, and deferred production from delayed well completion, all traceable to preventable mechanical failure that predictive maintenance system would have identified 18 days prior through bearing temperature anomaly and vibration pattern analysis. Yet despite these extraordinary costs, 68% of oilfield fleet operations still rely on reactive maintenance approaches and calendar-based service schedules that accept breakdowns as inevitable rather than implementing predictive intelligence systems proven to eliminate 72-84% of unplanned downtime through early fault detection and proactive intervention before catastrophic failures occur. This comprehensive analysis quantifies true economic impact of fleet downtime across drilling, completion, and production operations, reveals hidden cost categories invisible in traditional accounting, and demonstrates how FleetRabbit's AI-powered predictive maintenance platform transforms downtime from accepted operational reality into preventable exception. Schedule downtime cost analysis to quantify your exposure and prevention roadmap.
$500K
Per Hour Drilling Delay Cost
OILFIELD DOWNTIME ECONOMICS
The True Cost of Fleet Downtime: Why Single Vehicle Breakdown Costs More Than Your Entire Annual Fleet Budget
From drilling rig standby charges and completion crew demobilization to deferred production and contract penalties — comprehensive analysis of direct costs, indirect impacts, and opportunity losses that make oilfield fleet reliability more critical than any other transportation sector
72-84%
Downtime Elimination Through Predictive Maintenance
$2.8M
Single Breakdown Cost (Real Case Study)
18 Days
Advance Warning Predictive Systems Provide
Modern drilling rigs operating in major US basins cost $450,000-$850,000 daily under turnkey drilling contracts or day-rate agreements. When critical support vehicle breaks down — mud hauler delivering drilling fluid, wireline truck performing logging operations, or cementing unit required for casing operations — entire rig sits idle accumulating charges while generating zero production value. Rig contractor continues billing, crew remains on standby earning wages, and scheduled operational sequence disrupts creating compounding delays.
Real-World Example
Cementing unit transmission failure during critical casing operation forced 22-hour delay waiting replacement equipment. Drilling rig standby cost: $638,000. Cementing contractor demobilization and remobilization: $85,000. Deferred production from delayed completion: $420,000. Total impact from single transmission failure: $1,143,000.
Hydraulic fracturing and well completion operations require precise coordination of 8-15 specialized service providers arriving in specific sequence with exact timing windows. Single equipment failure disrupts entire choreography forcing crew demobilization, equipment standby charges, and eventual remobilization when replacement vehicle arrives. Completion contractors bill for standby time, minimum call-out charges apply for remobilization, and schedule disruption often pushes operation into less favorable time slots or creates multi-day delays awaiting next available crew.
$45K-$85K
Crew standby charges during breakdown resolution
$30K-$65K
Equipment demobilization and remobilization fees
$25K-$70K
Schedule disruption forcing operation into premium-rate time slot
$20K-$60K
Deferred follow-on operations cascading through schedule
Every day well completion delays represents deferred production revenue from reserves that would otherwise flow immediately upon well activation. New horizontal wells in Permian Basin typically produce 800-1,500 barrels daily in first 90 days with exponential decline curves making early production extremely valuable. Fleet breakdown extending completion timeline by even 3-5 days defers 2,400-7,500 barrels of highest-value production while fixed costs (land leases, mineral rights, debt service) continue accumulating without offsetting revenue generation.
Deferred Production Impact Calculation
Revenue Impact:
$281,000 deferred revenue
Service contracts with major operators and midstream companies often include strict performance guarantees with financial penalties for missed delivery windows, incomplete service execution, or operational delays attributable to contractor equipment failures. Pipeline gathering agreements specify maximum response times for emergency valve maintenance. Drilling contracts define completion timeline targets with liquidated damages for delays. Tank battery service agreements mandate maximum response times for produced water hauling preventing overflow incidents.
Pipeline Emergency Response SLA
$125K penalty for exceeding 4-hour response window due to equipment unavailability
Well Completion Timeline Guarantee
$15K per day liquidated damages for completion delays exceeding contracted schedule
Produced Water Hauling Agreement
$75K environmental remediation liability if tank overflow occurs during equipment failure period
Breakdowns occurring during active operations trigger emergency repair response with premium pricing for after-hours technician dispatch, expedited parts procurement via air freight, and field service calls to remote wellsite locations. Routine transmission rebuild costing $8,500 at shop becomes $28,000 emergency field repair. Standard brake replacement at $1,200 escalates to $4,200 when technician dispatched to wellsite at midnight. Parts normally ordered ground shipping for $180 arrive via overnight air freight at $940.
Planned Shop Repair
$8,500
VS
Emergency Field Repair
$28,000
Emergency premium multiplier: 3.3× normal cost
Primary mechanical failures frequently cause secondary damage when operators attempt to continue operating compromised equipment or when failure mode damages interconnected systems. Engine overheating from coolant leak damages cylinder heads requiring replacement beyond initial repair. Transmission failure metal contamination destroys torque converter and damages differential. Brake failure accident causes frame damage, suspension destruction, and cargo equipment losses far exceeding original brake system repair cost.
Primary Failure: Coolant leak from deteriorated hose ($180 part, $450 labor)
Cascade Impact: Continued operation caused engine overheat destroying cylinder heads ($18,500), warping engine block requiring replacement ($42,000), contaminating cooling system ($3,200 flush), total cascade damage: $63,700 from ignored $630 initial repair
Beyond measurable financial impacts, fleet unreliability creates strategic costs through damaged client relationships, lost contract renewals, diminished bidding competitiveness, and opportunity costs from management attention diverted to crisis response rather than growth initiatives. Operator experiencing repeated equipment failures during critical client operations faces contract non-renewal despite competitive pricing. Service provider with reputation for unreliability excluded from bid opportunities regardless of technical capability or cost advantages.
Contract renewal declined due to reliability concerns: $2.4M annual revenue loss
Excluded from major operator's approved vendor list: $8M opportunity pipeline closure
Executive time diverted to crisis management: 180 hours quarterly unavailable for strategic initiatives
Fleet downtime costs in oilfield operations exceed traditional transportation sectors by 15-40× due to operational cascade impacts invisible in maintenance accounting. FleetRabbit's predictive intelligence eliminates 72-84% of unplanned downtime through fault detection 7-30 days before catastrophic failures occur. Start preventing million-dollar breakdowns today.
REAL-WORLD DOWNTIME IMPACT
How $2.8M Loss From Single Transmission Failure Could Have Been Prevented
Permian Basin completion services provider operating 85-vehicle fleet supporting hydraulic fracturing operations experienced catastrophic transmission failure on frac sand hauler during active pumping stage of multi-well pad development. Breakdown occurred at 2:40 AM during critical proppant delivery requiring continuous sand supply to maintain downhole pressure and prevent screenout. Transmission failure immobilized truck with 45,000 pounds of proppant load requiring emergency unloading, towing, and replacement vehicle sourcing.
2:40 AM
Transmission failure immobilizes frac sand hauler during active pumping
Immediate: Frac operation suspended, crew on standby, wellbore pressure managed
3:15 AM
Emergency towing arranged, backup truck search initiated
No available replacement truck within 180-mile radius during peak completion season
6:45 AM
Replacement truck located 240 miles away, mobilization begins
Frac crew demobilization decision made due to extended delay expectation
4:20 PM
Replacement truck arrives on location, operations resume preparation
Total operational suspension: 14 hours from initial failure to restart
Drilling rig standby charges (14 hours)
$434,000
Frac crew demobilization and remobilization
$185,000
Equipment standby fees (pressure pumpers, wireline, coil tubing)
$127,000
Emergency towing and equipment recovery
$8,400
Emergency transmission rebuild with field service
$31,500
Schedule disruption pushing subsequent operations into premium slots
$94,000
Deferred production from completion delay (3.2 days average)
$1,920,000
Total Downtime Cost
$2,799,900
Post-failure analysis revealed transmission exhibited clear warning indicators 18 days prior to catastrophic failure. FleetRabbit's AI predictive maintenance system monitoring fault codes, fluid temperature patterns, and shift quality metrics would have detected transmission clutch degradation through three distinct anomaly patterns:
Transmission fluid temperature elevated 12-18°F above baseline during normal operations
Detected 18 days before failure through continuous temperature monitoring
Shift quality deterioration with delayed engagement and harsh transitions
Detected 11 days before failure through shift pattern analysis algorithms
Fault code P0730 (incorrect gear ratio) appearing intermittently then with increasing frequency
Detected 9 days before failure through fault code correlation and frequency trend analysis
Preventive Action Outcome
With 18-day advance warning, transmission could have been rebuilt during scheduled downtime between completion stages at shop labor rates ($8,500 total cost) preventing $2.8M operational shutdown. Predictive maintenance ROI on this single prevented failure: 33,000% return on annual FleetRabbit subscription cost for 85-vehicle fleet.
LAYER 1
Continuous Fault Code Monitoring
Direct connection to vehicle Engine Control Unit captures diagnostic trouble codes as they occur, monitoring 200+ fault code types across engine, transmission, emissions, brake, and chassis systems. System tracks not only active faults visible to driver but also pending codes, historical occurrences, and intermittent issues that traditional reactive approaches miss until catastrophic failure forces attention.
Real-Time Code Detection
Fault codes transmitted to cloud platform within 60 seconds of ECU logging, enabling immediate maintenance team notification rather than waiting for driver report or routine inspection discovery
Frequency Pattern Analysis
AI tracks fault code occurrence frequency identifying escalating patterns where intermittent issues become persistent failures — critical early warning indicator
Cross-System Correlation
Platform correlates related fault codes across multiple vehicle systems identifying root causes versus treating symptoms — preventing misdiagnosis and incomplete repairs
LAYER 2
Behavioral Anomaly Detection
Machine learning algorithms establish normal operating baselines for each vehicle across fuel consumption, idle time, temperature patterns, acceleration profiles, and performance metrics — then flag deviations indicating developing mechanical issues before fault codes trigger. This layer catches problems in pre-failure stage when component degradation begins but hasn't reached threshold triggering formal diagnostic codes.
Fuel Efficiency Degradation
Gradual MPG decline indicates developing issues: fuel system problems, air intake restrictions, or transmission slippage long before driver notices performance change
Temperature Anomaly Tracking
Engine, transmission, differential, and brake temperatures monitored for patterns outside normal ranges indicating cooling system degradation, fluid issues, or bearing failures
Performance Characteristic Changes
Acceleration profiles, top speed capability, and power delivery patterns analyzed to detect engine performance degradation from turbocharger failures, fuel delivery issues, or valve train problems
LAYER 3
Predictive Failure Forecasting
AI models trained on historical failure data from 10,000+ oilfield vehicles analyze current fault patterns, operating conditions, maintenance history, and duty cycle stress to predict probability and timeline of specific component failures. System generates failure forecasts with 7-30 day advance warning and 87-92% accuracy enabling proactive scheduling of repairs during planned downtime windows.
Component-Specific Predictions
Separate predictive models for transmission failures, turbocharger issues, brake system problems, cooling system failures — each calibrated to failure modes specific to that component class
Confidence Scoring
Each prediction includes confidence level and timeline range enabling maintenance teams to prioritize interventions and schedule repairs appropriately based on urgency and certainty
Cost Impact Forecasting
System estimates repair cost if addressed proactively versus catastrophic failure impact including cascade damage and operational downtime — quantifying ROI of immediate intervention
LAYER 4
Automated Intervention Workflows
Predictive alerts automatically trigger intervention workflows including maintenance work order creation, technician assignment, parts ordering, and operational coordination to ensure predictions convert into preventive actions rather than remaining unaddressed warnings. Integration with dispatch systems enables intelligent vehicle reassignment pulling high-risk assets from critical operations while scheduling repairs.
Automatic Work Order Generation
Critical predictions create maintenance work orders automatically with diagnostic information, recommended parts, and estimated labor — eliminating delay between detection and repair scheduling
Parts Procurement Integration
System cross-references predicted failures against parts inventory triggering automatic ordering when stock unavailable — ensuring parts arrive before failure occurs rather than emergency expediting after breakdown
Dispatch Coordination
Platform communicates with dispatch to avoid assigning vehicles with high failure probability to critical operations — managing risk through intelligent deployment rather than hoping problems don't occur
PREDICTIVE MAINTENANCE PLATFORM
Eliminate 72-84% of Preventable Downtime Through AI-Powered Failure Prediction
FleetRabbit's four-layer predictive intelligence architecture provides 7-30 days advance warning of component failures with 87-92% accuracy — sufficient lead time to schedule repairs during non-critical windows preventing million-dollar operational shutdowns from unexpected breakdowns during active drilling, completion, or production operations.
87-92%
Prediction Accuracy
7-30 Days
Advance Warning
72-84%
Downtime Eliminated
Representative Oilfield Fleet Profile
Fleet size: 120 vehicles (drilling support, completion services, production operations)
Current unplanned downtime: 18 events annually averaging 8.5 hours per incident
Average operational impact: $285,000 per downtime event (blended across severity levels)
Current annual downtime cost: $5,130,000
FleetRabbit platform subscription (120 vehicles × $3/month)
$4,320 annually
Telematics hardware installation (120 units × $165)
$19,800 one-time
Implementation and training
$0 (included)
First Year Total Investment
$24,120
Conservative downtime elimination rate
72%
Prevented downtime events annually
13 of 18 events
Annual cost avoidance
$3,705,000
Net first-year benefit
$3,680,880
Payback Period
2.8 Days
Investment recovered through first prevented catastrophic failure during initial month of operation
First-Year ROI
15,265%
Return calculated as net benefit divided by total investment
3-Year Cumulative Benefit
$11,102,640
Compounding value from consistent downtime prevention across multi-year horizon
$500K
Per Hour Drilling Delay Cost
STOP ACCEPTING PREVENTABLE DOWNTIME
Eliminate Million-Dollar Breakdowns Through Predictive Intelligence
Single prevented catastrophic failure during critical operation pays for multi-year FleetRabbit subscription across entire fleet. With 87-92% prediction accuracy and 7-30 days advance warning, FleetRabbit transforms downtime from inevitable operational reality into preventable exception through AI-powered fault detection and proactive intervention workflows.
72-84%
Downtime Events Prevented
$3/Vehicle
All-Inclusive Monthly Cost
2.8 Days
Typical Payback Period
15,000%
Average First-Year ROI
7-30 Day Advance Warning
87-92% Prediction Accuracy
Automated Work Orders
Parts Procurement Integration
Dispatch Coordination
Real-Time Fault Monitoring
April 29, 2026
By David
All Posts