Digital twin fleet fuel optimization software uses virtual vehicle replicas, real-time sensor data and AI simulation to identify and eliminate fuel waste before it happens. Fleets using digital twin fuel analytics report 15%+ fuel cost reductions, 10-30% fewer unplanned breakdowns, and measurable improvements in driver behavior without adding headcount. This guide covers how digital twin simulation works for fuel optimization, what it actually simulates, the ROI math, and how FleetRabbit delivers digital twin fuel intelligence at $3/vehicle/month.
What Is a Digital Twin for Fleet Fuel Optimization?
A digital twin is a virtual replica of a physical asset in this case, your vehicles, routes, and drivers — continuously updated with real-time operational data from sensors, IoT devices, and telematics systems. For fleet fuel optimization, this means the software builds a living virtual model of every truck or van in your fleet, capturing engine performance, fuel consumption patterns, driving behavior, route conditions, and load weight — and uses that model to simulate scenarios you have not experienced yet.
The critical difference from standard fleet telematics is what happens after data is collected. Traditional telematics shows what is happening now. Digital twin technology goes further — predicting what is next using real-time data, simulations, and AI. It shifts fleet operations from reactive monitoring to proactive optimization. For fuel management specifically, that means identifying which driver behavior, route choice, vehicle configuration, or maintenance condition is burning the most unnecessary fuel — and simulating the fix before you commit to it in the real world.
FleetRabbit delivers digital twin fuel analytics at $3/vehicle/month. Start free for up to 3 vehicles — no credit card required.
The 5 Fuel Drains Digital Twin Simulation Catches That Reports Miss
Fuel costs are one of the most complex line items in fleet operations because waste comes from multiple overlapping causes simultaneously. A digital twin isolates each cause independently — something a standard fuel report cannot do.
Driver Behaviour Patterns
Accounts for 20-30% of avoidable fuel wasteHarsh acceleration, late braking, excessive idling, and over-speeding are the biggest individual contributors to fuel overconsumption — but standard reports only show averages. A digital twin models every driver's specific behaviour pattern against the vehicle and route context, isolating exactly which manoeuvres on which segments are costing fuel. Digital twins evaluate driver performance by monitoring patterns such as hard braking, overspeeding, or prolonged idling — insights that allow fleet managers to implement targeted training programs that improve safety and fuel efficiency.
Suboptimal Route Selection
Accounts for 15-25% of avoidable fuel wasteThe fastest route on a map is not the most fuel-efficient route for a 7.5-tonne truck. Gradient, road surface, traffic stop frequency, and vehicle load all affect fuel consumption per kilometre. AI calculates the most fuel-efficient routes considering traffic, terrain, fuel stops, and delivery windows — reducing miles, avoiding congestion, and optimising multi-stop sequences. A digital twin simulates how each route option performs for a specific vehicle type and load before the truck leaves the depot.
Engine and Component Degradation
Accounts for 10-18% of avoidable fuel wasteA vehicle running with a partially clogged fuel injector, under-inflated tyres, or degrading air filter consumes 5-15% more fuel than a well-maintained equivalent — but standard telematics will not flag this until it causes a breakdown. A digital twin detects a drop in turbocharger efficiency in a long-haul truck, identifying fuel-draining engine anomalies before they escalate into costly breakdowns. The simulation compares each vehicle's actual fuel consumption against its expected consumption model, flagging anomalies that indicate component issues.
Vehicle-to-Load Mismatches
Accounts for 8-15% of avoidable fuel wasteDispatching a 12-tonne truck for a 3-tonne load, or running a van at 110% capacity on a hilly route, creates systematic fuel inefficiency that no report can identify because it requires cross-referencing load data, vehicle specifications, and route gradient simultaneously. A digital twin does this automatically — simulating the fuel cost of each vehicle-load-route combination and recommending the optimal vehicle assignment per delivery run.
Idle Time — The Invisible Drain
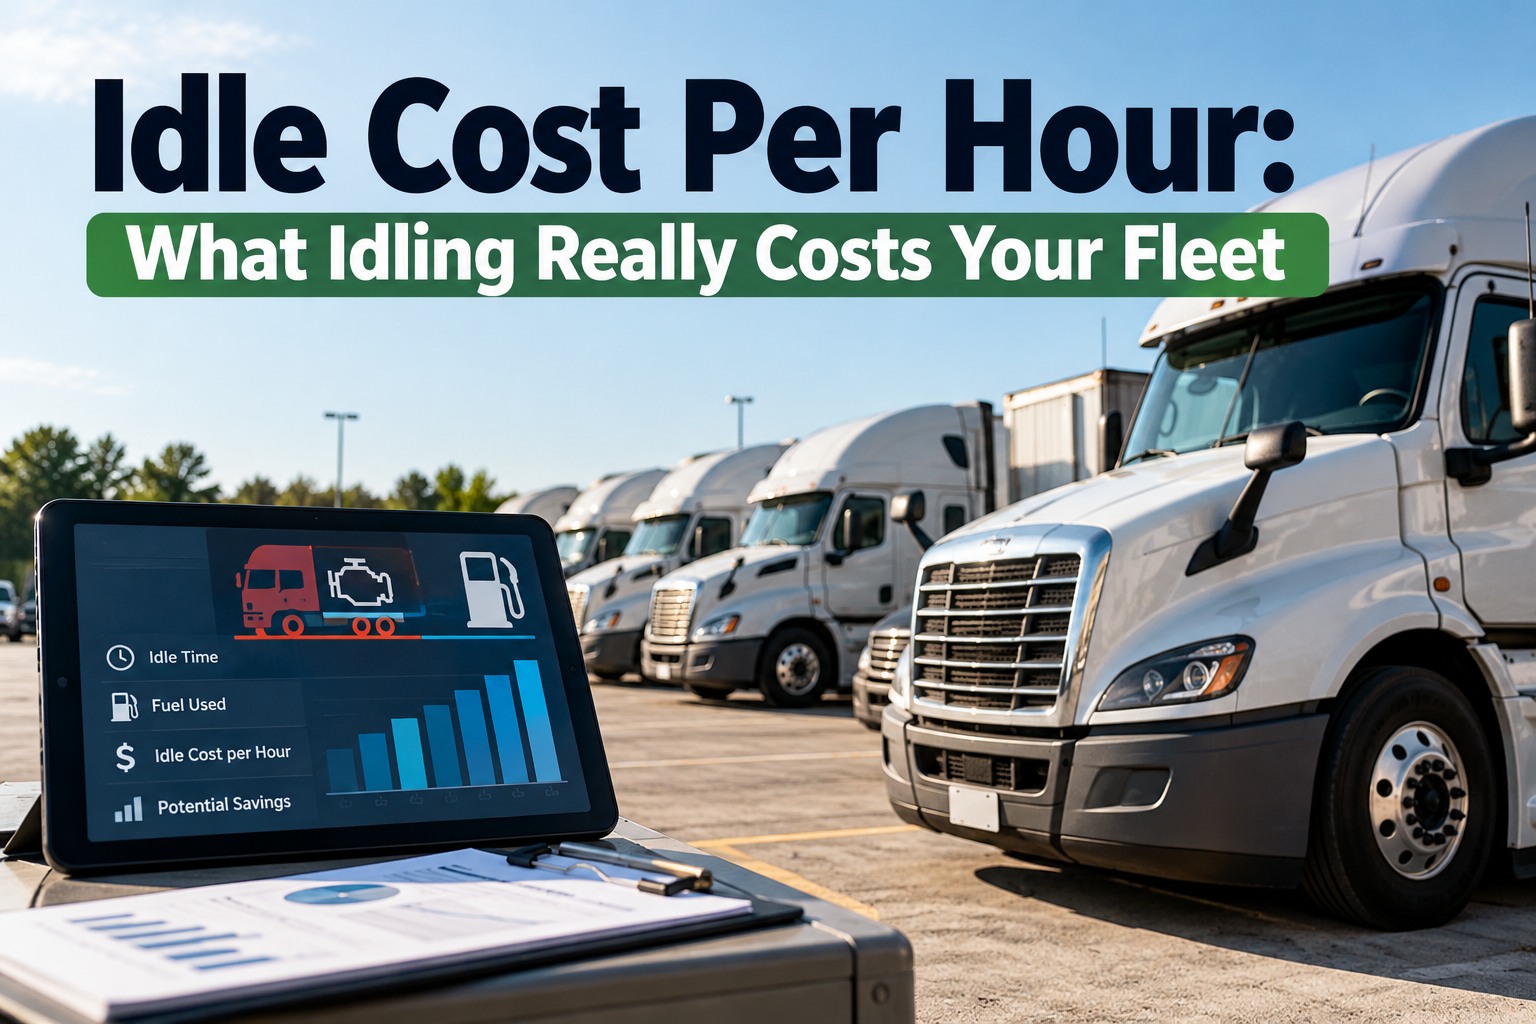
1 hour idling = 1 litre of diesel burnedEvery hour a diesel engine idles burns approximately 1 litre of fuel. For a 20-truck fleet averaging 45 minutes of daily idle time per vehicle, that is 15 litres per day, 5,475 litres per year, wasted producing zero work. A digital twin maps idle patterns against route schedules, identifying whether idling is occurring at loading bays, in traffic, or during off-duty periods — and simulates the fuel saving from each intervention.
FleetRabbit simulates all 5 fuel drains for your specific fleet — not generic benchmarks.
Real vehicle data, real routes, real driver behaviour. AI fuel simulation showing exactly where your fleet is losing money and what to do about it. Free for up to 3 vehicles.
How Digital Twin Fuel Simulation Works — The Technical Flow
Understanding what actually happens inside a digital twin fuel platform helps fleet managers evaluate vendors and set accurate expectations for data requirements, implementation time, and output quality.
Data Ingestion — Building the Vehicle Model
Sensors embedded in vehicles collect extensive real-time data including fuel efficiency, engine performance, GPS location, tire pressure, battery health, and driver behavior. For each vehicle, the platform builds a unique consumption model calibrated against make, model, age, engine specification, and actual historical fuel data. The model accounts for road gradient, payload weight, ambient temperature, tyre pressure, and engine health — creating a baseline that reflects how this specific vehicle behaves, not a manufacturer average.
Continuous Model Updating — The Twin Stays Current
A digital twin functions by continuously updating a virtual replica of a physical asset with real-time data — enabling simulation, analysis, optimization, and monitoring of the physical counterpart. Every trip, every refuelling, every maintenance event updates the twin. As the vehicle ages and its consumption characteristics change, the model adapts. This means fuel waste signals stay accurate over time — the twin reflects the actual state of the vehicle today, not its state 18 months ago when it was first profiled.
Scenario Simulation — Testing Changes Before They Happen
This is where digital twin technology delivers its most distinctive value. The platform runs simulation scenarios against the vehicle's model — testing what would happen to fuel consumption if route A were substituted for route B, if Driver X's acceleration profile were adjusted, or if Vehicle FR-08 were serviced before next week's run. These are not estimates — they are simulations calibrated against the actual vehicle's consumption data. The result is a projected fuel saving figure, not a guess.
Prescriptive Output — Actions, Not Just Charts
Digital twin technology shifts fleet operations from reactive monitoring to proactive optimization — offering prescriptive and predictive analytics: what will happen and what to do about it. The platform does not produce a dashboard of metrics and leave interpretation to you. It produces a prioritised action list: the 3 route changes, 2 driver coaching sessions, and 1 maintenance intervention that will generate the highest fuel saving this week — ranked by projected impact and sorted by implementation effort.
Want to see the simulation output for your fleet? Book a FleetRabbit demo — we will run a fuel waste simulation on your actual route and vehicle data live.
Digital Twin Fuel Optimisation — ROI by Fleet Size
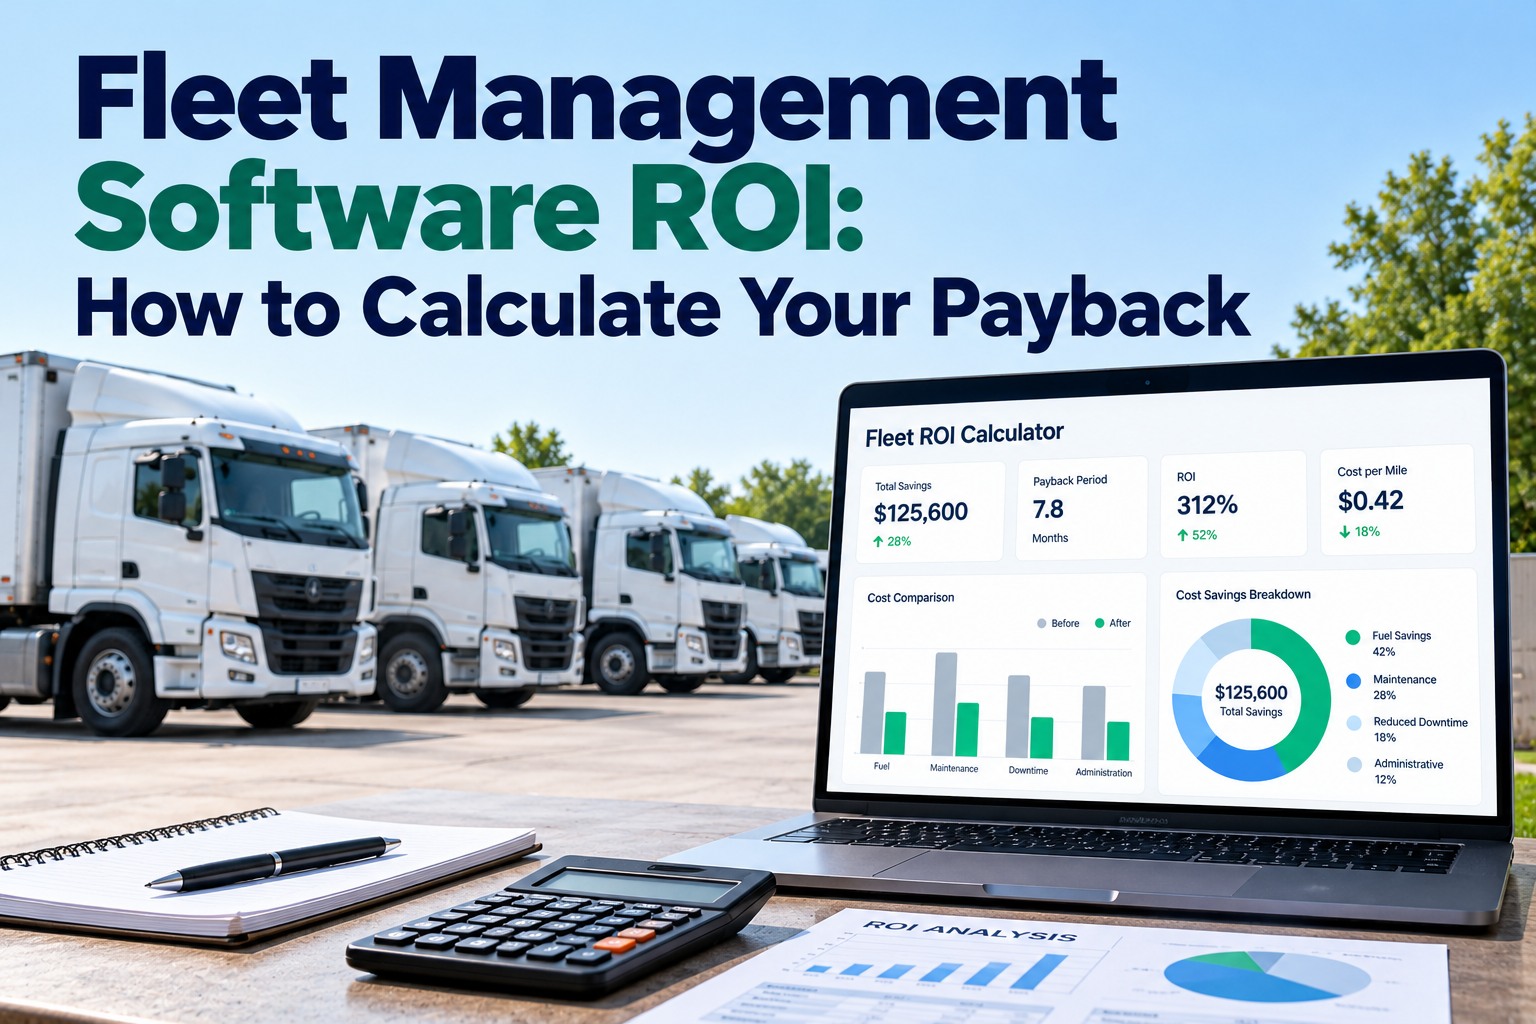
Fuel eats up 30-40% of total fleet operating costs. In 2026, AI-powered fuel management is the difference between fleets bleeding money and those achieving 10-15% fuel cost reductions. Here is what a conservative 15% fuel saving looks like in real dollars. FleetRabbit: free up to 3 vehicles, from $3/vehicle/month.
Book a demo to model your fleet's specific fuel saving potential — we will run the calculation using your actual fleet size and fuel spend.
Use Cases — Digital Twin Fuel Simulation by Fleet Type
Digital twin fuel optimisation adapts to the specific consumption patterns of different fleet operations. Here is how simulation works differently across the most common commercial fleet types.
Highway Efficiency Optimisation
Long-haul trucks spend 8-14 hours at highway speeds where aerodynamic drag and cruise control settings dominate fuel consumption. Digital twin simulation models the fuel cost of different speed profiles, gear shift patterns, and route elevation changes — identifying the optimal cruise speed window for each vehicle's engine spec on each major corridor.
Stop-Start Cycle Optimisation
Urban delivery vehicles spend a disproportionate share of operating time in stop-start cycles where engine idling, acceleration from standstill, and low-speed manoeuvring create fuel consumption 40-60% higher per kilometre than highway driving. The digital twin identifies which stops generate the highest idle and acceleration events — and simulates route re-sequencing to smooth the driving cycle.
Collection Route Fuel Modelling
Waste collection routes combine urban stop-start driving with heavy payload — a full refuse truck at 26 tonnes burns significantly more fuel per stop than the same vehicle at 12 tonnes. The digital twin models payload weight across the collection sequence and simulates how different stop orderings affect cumulative fuel use as the truck fills.
Site-to-Site Transfer Efficiency
Construction and trade vehicles often run partially loaded on return journeys and may idle for extended periods at sites waiting for access or unloading windows. The digital twin maps idle events against operational schedules — identifying whether a 10-minute schedule adjustment at Site 3 eliminates 45 minutes of daily idle time across three vehicles visiting that site.
FleetRabbit Digital Twin Fuel Optimisation — What Is Included
FleetRabbit delivers digital twin fuel simulation without enterprise implementation costs, dedicated data science teams, or 12-month minimum contracts. Here is exactly what the platform provides.
Per-Vehicle Fuel Consumption Model
Individual digital twin for each vehicle — calibrated against actual telematics data, vehicle spec, and operating history. Not a manufacturer average. Your truck, your routes, your patterns.
Route Fuel Simulation
Compare fuel cost of alternative routes for a specific vehicle and load before dispatching. AI selects the fuel-optimal route — not just the shortest or fastest.
Driver Behaviour Fuel Impact Scoring
Quantify the fuel cost of each driver's behaviour profile in dollars per day. Show drivers exactly how much their current patterns cost and simulate the saving from coaching.
Maintenance Fuel Impact Detection
Identify when a vehicle's actual fuel consumption deviates from its modelled baseline — flagging engine or component issues that are increasing fuel spend before they cause a breakdown.
Idle Time Simulation and Scheduling
Map idle patterns against route and depot schedules. Simulate the fuel saving from scheduling adjustments, geofence-triggered engine-off zones, and driver idle alerts.
Fleet-Wide Fuel Benchmarking
Compare every vehicle against its own model baseline and against equivalent vehicles in the fleet. Identify the top 3 fuel-saving opportunities across the entire operation — ranked by dollar impact.
Digital twin fuel simulation at $3/vehicle/month.
No enterprise contract. No 6-month implementation. FleetRabbit delivers digital twin fuel optimisation free for up to 3 vehicles, paid plans from $3/vehicle/month. Most fleets generate fuel saving recommendations within 5 business days.
Frequently Asked Questions
What is digital twin fleet fuel optimization?
Digital twin fleet fuel optimization uses a virtual replica of each vehicle — continuously updated with real-time telematics, sensor readings, and operational records — to simulate fuel consumption under different conditions. Unlike fuel reports that show what already happened, a digital twin predicts what will happen and simulates the outcome of interventions before you implement them. It identifies the specific combination of driver behavior, route choice, vehicle condition, and load assignment responsible for excess fuel spend — and ranks the actions that will generate the highest saving. FleetRabbit delivers digital twin fuel simulation from $3/vehicle/month, free for up to 3 vehicles. Start a free trial today.
How much fuel can digital twin simulation actually save?
Most commercial fleets achieve 15-22% fuel cost reductions with digital twin optimization — with variation depending on how inefficient current operations are. Fleets with unmanaged driver behavior, suboptimal route assignments, and deferred maintenance typically achieve the higher end of this range. In 2026, AI-powered fuel management is the difference between fleets bleeding money and those achieving 10-15% fuel cost reductions, with fuel eating 30-40% of total fleet operating costs. For a 25-truck fleet spending $300,000 annually on fuel, a conservative 15% saving is $45,000 per year — against a FleetRabbit platform cost of $900 per year. Book a demo to model your specific fleet's saving potential.
How is a digital twin different from regular fleet telematics?
Regular fleet telematics gives you descriptive analytics — what your vehicles did, where they went, how much fuel they used. A digital twin adds predictive and prescriptive layers. It builds a calibrated model of each vehicle's consumption behaviour, continuously updated with real data, and uses that model to simulate future scenarios. The key difference in practice: telematics tells you Driver A used 12% more fuel last month. A digital twin tells you that 63% of that excess came from acceleration patterns on stops 6-11 of Route 14, and that a specific coaching intervention would save $1,400/year on that driver's fuel spend. The simulation converts data into actionable decisions — not just charts you have to interpret manually.
What data does a digital twin fleet fuel platform need to get started?
FleetRabbit's digital twin fuel model requires three inputs: vehicle telematics data (GPS, speed, engine parameters via OBD-II or CAN bus), fuel transaction records (from fuel cards or manual logs), and vehicle specification data (make, model, year, engine type, and GVM). Historical data from 30 days is sufficient to build an initial consumption model. The model improves continuously as more operational data is collected — predictions become more accurate over 60-90 days of operation. Most fleets can connect existing telematics data without replacing hardware. Book a demo to check compatibility with your current setup.
How long does it take to see fuel savings from digital twin optimization?
Most FleetRabbit customers see their first actionable fuel saving recommendations within 5-7 business days of completing setup. Early quick wins from idle time reduction and driver behavior coaching can be acted on immediately and show measurable fuel impact within the first 2 weeks. Route optimization simulations require 15-30 days of operational data to be fully calibrated. Maintenance-related fuel anomaly detection begins within the first 30 days as the baseline consumption model solidifies. Start your free trial or book a demo to walk through the onboarding process.