Ramps fail on logistics ceilings that nobody modelled, because the ramp plan is almost always built as a production plan. Somebody establishes that the line can run the volume, the suppliers confirm they can make the parts, and the programme proceeds — while the gate that processes fourteen trucks an hour, the four doors eligible for the freight in question, and the yard that already runs at seventy-eight per cent are all left out of the arithmetic entirely. They do not fail gracefully either. Volume magnifies every process weakness, and a yard that copes at current volume does not cope at 1.4× because queueing behaviour is non-linear, not proportional. The uncomfortable pattern across industries attempting step-changes is that confidence collapses well before the numbers look extreme: executives are broadly confident at 1.25× current rates, and beyond 2× that confidence falls by nearly half. This is how to check the logistics ceilings before you commit to a curve. Request the integration datasheet to run the checks against your own site.
READINESS GUIDE · PRODUCTION RAMP
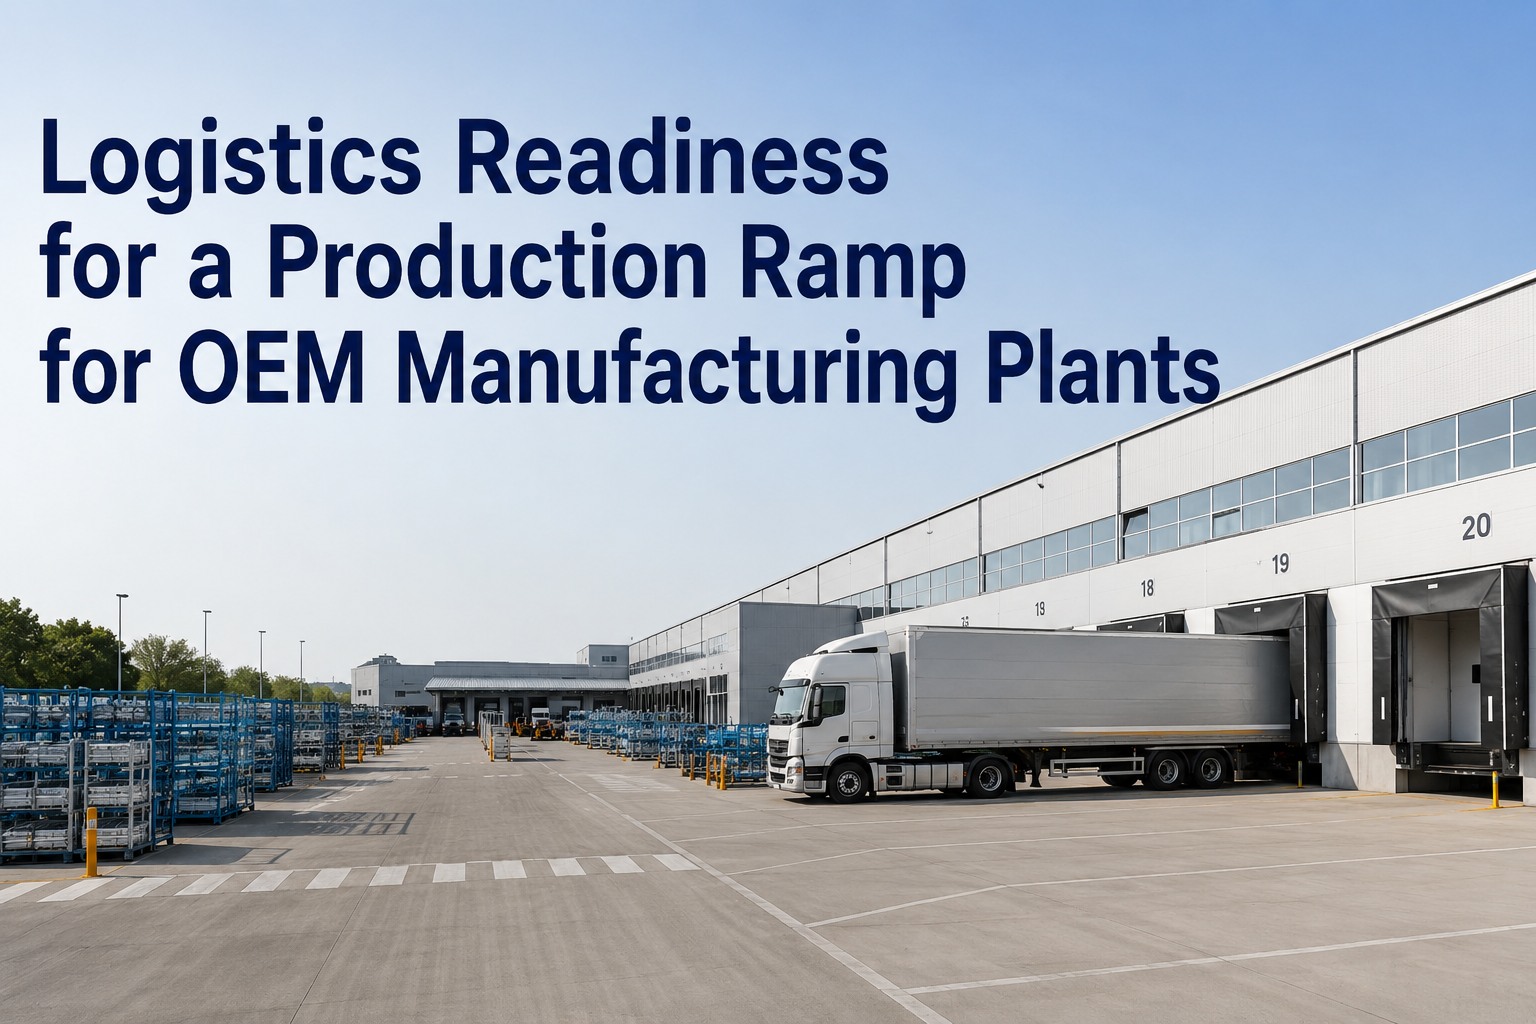
Logistics Readiness for a Production Ramp
Volume step-changes checked against yard, dock and gate ceilings rather than line capacity alone, supplier capability reviewed at rate rather than on paper, and contingency triggers defined before the curve begins.
Logistics ceiling
Pilot
0.5×
1.0×
1.4×
2.0×
The line ceiling is usually the one everyone models. The gate, the eligible doors and the yard are usually the ones that bind first — and they bind non-linearly, so the step that breaks them looks modest right up until it happens.
Six Logistics Ceilings to Compute First
Each of these caps throughput independently of the line. Compute all six against the target rate before the ramp curve is agreed, because any one of them binding turns a production plan into a queue.
Gate transaction rate
Trucks processed per hour per lane. The barrier is a queueing system, and past roughly 90% utilisation waiting time climbs disproportionately rather than proportionally.
CheckTarget arrivals per peak hour against measured transactions per hour per lane, at 80% not 100%
Eligible door hours
Not total doors — doors eligible for this freight, by leveler capacity, trailer length, unload method and zone. Ramp volume usually lands on a specific tier.
CheckAdditional loads per day × slot duration, against available hours on the eligible tier only
Yard positions
Sustained utilisation above roughly 80% makes every shunt move slower and extraction errors more frequent, so physical capacity is not working capacity.
CheckProjected trailers on site at peak against 80% of physical positions, including the empty pool
Shunt move capacity
Moves per spotter per shift, typically in the fifteen to twenty-five range and falling as the yard fills. Ramp adds moves faster than it adds volume, because rehandles rise with density.
CheckProjected moves per shift against current productivity, then again against productivity at higher yard fill
Line-side rack capacity
Positions and replenishment frequency at the station. Higher rate means faster consumption, which shortens replenishment time and re-sizes every kanban loop feeding the line.
CheckConsumption per hour at target rate against rack hold time and current route frequency
Returnable container pool
The ceiling nobody computes. More volume means more containers in circulation at every point in the loop simultaneously, and pools do not stretch.
CheckCycle time × target consumption rate against current pool size, per container type
Volume magnifies every process weakness
Hidden bottlenecks surface at rate — the operation you believed took thirty seconds turns out to take ninety once part handling, tool changes and quality checks are counted. The same applies on the logistics side: the gate transaction that averages four minutes is six when documentation is not pre-matched, and at current volume that difference is absorbed by slack you will not have at 1.4×. Measure the components, not the averages, before the ramp begins.
Supplier Capability, Reviewed at Rate
Your ramp is only as fast as your slowest supplier, and supply-chain readiness is where most scale-up programmes stall — almost always because procurement was engaged too late. Production capability is normally verified properly through APQP and PPAP, with production readiness confirmed by run-at-rate testing under real cycle-time conditions. What is rarely verified is whether the supplier's logistics can run at rate.
← Swipe to see all columns →
Capability validation has to look beyond output. Whether existing processes support projected demand, whether bottleneck operations are actually understood, whether sufficient equipment exists, and whether additional capacity can realistically be achieved are four different questions — and a supplier can answer the first convincingly while failing the other three. Capacity reservation agreements, where a supplier holds volume against a purchase commitment, are the mechanism for converting a confident answer into an obligation.
Most ramp plans model the line and assume the yard. The yard binds first.
The integration datasheet covers how gate, dock, yard and line-side capacity are measured against a target curve, what data each check needs, and how the contingency triggers are wired.
Readiness Gates, With Entry Criteria
Four gates. Each one has criteria that must be met to enter it — not to exit it, which is the more common and much weaker formulation, since exit criteria are assessed when it is already too late to act on them.
G1Ceiling computation
All six logistics ceilings computed against the target curve, with the binding constraint identified by name and the step at which it binds.
Cannot enter withoutMeasured current-state figures, not design figures
G2Supplier logistics at rate
Packaging pools sized, labelling and despatch advice tested at volume, sequencing verified at cadence, sub-tier lead times visible.
Cannot enter withoutProduction run-at-rate already passed
G3Logistics pilot at a step
Run one intermediate step of the curve deliberately and hold it, measuring the ceilings under real conditions rather than modelled ones.
Cannot enter withoutA defined hold period and named owner per ceiling
G4Full rate with triggers armed
Proceed to target with contingency triggers live and authorisers named, so a breach produces a decision rather than a meeting.
Cannot enter withoutEvery trigger tested at least once in the pilot step
Hold the intermediate step longer than feels necessary
The temptation on a ramp is to treat each step as a waypoint to pass through. But a ceiling that binds intermittently at 1.2× will bind constantly at 1.5×, and the intermittent version is the only affordable place to find it. A held step is cheap diagnosis; the same discovery at full rate is a recovery programme with a line waiting on it.
Contingency Triggers
Define these before the curve starts and name the authoriser for each. A trigger without a pre-authorised action is an alert, and alerts do not stop ramps failing.
Gate queue exceeds threshold for two consecutive shifts
Pre-authorised actionRedistribute slots off-peak and open off-site holding with call-forward. No capital, no approval delay.
Yard utilisation sustained above 80%
Pre-authorised action">Suspend non-priority admission, escalate empty collections, and hold the next ramp step until it recovers.
Eligible-tier door utilisation above 85%
Pre-authorised actionRe-tier one general door, or reroute the freight that does not genuinely need the tier.
Container pool position falls below cycle requirement
Pre-authorised actionRelease pre-agreed additional pool and escalate collection cadence with the affected suppliers.
Supplier misses window twice inside the ramp period
Pre-authorised actionMove to the improvement rung of the escalation ladder immediately rather than on the normal cadence.
Premium freight exceeds ramp allowance
Pre-authorised actionPause the curve at the current step. Expedite spend is the clearest signal a ceiling has been crossed.
What to Track Through the Ramp
Six figures, tracked per step rather than per month, because a monthly view will report the problem after the next step has already been taken. Our analytics and reporting module carries the ramp view.
Headroom against each ceilingCurrent position as a share of the computed limit, per ceiling. Watch the trend, not the level — the slope tells you which step it breaks at.
Gate and dock queue at the 90th percentileAverages will look fine throughout a ramp that is failing at peak. Percentiles show the peak degrading first, as it always does.
Moves per extractionRises as the yard fills, and it rises before utilisation looks alarming. One of the earliest available warnings.
Supplier window adherence, by stepCompare each step against the last. A supplier degrading between steps will not recover at the next one without intervention.
Premium freight per unit producedNormalised for volume so the ramp does not hide it. Rising per-unit expedite spend is a ceiling being paid for rather than solved.
Container pool coveragePool size against cycle time at current rate. Falls silently and is discovered as a shortage weeks later.
Find the Binding Ceiling Before You Commit the Curve
The integration datasheet sets out how each of the six ceilings is computed from data you already hold, what measurement is needed where it is not, how the gate criteria and pilot step are structured, and how contingency triggers connect to gate, yard and dock systems so a breach produces an action rather than a notification.
Six-ceiling computation
Supplier logistics at rate
Held-step pilot design
Armed contingency triggers
Frequently Asked Questions
Which ceiling usually binds first?
Yard positions or eligible door hours, in most plants. Both are frequently assessed against physical capacity rather than working capacity — sustained yard utilisation above roughly 80% slows every shunt move and raises extraction errors, and door capacity has to be computed against the tier eligible for the specific freight rather than the total door count. Gate transaction rate binds next and most abruptly, because queueing is non-linear: the step that pushes utilisation past about 90% produces a disproportionate jump in waiting rather than a proportional one.
Why does a supplier who passed PPAP still fail the ramp?
Because production capability and logistics capability are verified differently, and usually only the first is verified at all. APQP and PPAP with run-at-rate testing under real cycle-time conditions confirm the supplier can make the parts at cadence. They say nothing about whether the container pool is sized for the new volume, whether manual labelling steps that worked at ten loads a week survive fifty, or whether sub-tier minimum order quantities and lead times can support the step. Add a logistics run-at-rate to the gate criteria.
How large a step is safe?
Smaller than the numbers suggest, and the evidence across industries attempting step-changes is consistent: confidence is broadly high at around 1.25× current rates and falls by nearly half beyond 2×, with a substantial share of the industrial base unable to commit to 3–4× on any timeline. That pattern reflects the non-linearity in the constraints rather than pessimism. Practically, size the step so that no computed ceiling exceeds about 80% of its limit at the new level, then hold and measure before the next one.
Why compute capacity at 80% rather than 100%?
Because the last twenty per cent is where recovery capacity lives, and a ramp without recovery capacity converts every ordinary disruption into a production event. A gate at full theoretical utilisation cannot absorb a late carrier; a yard at full positions cannot absorb an early arrival; a dock at full door hours cannot re-slot a missed appointment. Planning to physical capacity guarantees you operate above the threshold on your busiest days, which are precisely the days the slack was for.
What should the pilot step actually prove?
That the computed ceilings behave as modelled under real conditions, and that every contingency trigger fires and produces its pre-authorised action. Run one intermediate step, hold it long enough that peaks and day-of-week effects appear, and treat any ceiling that binds intermittently as a ceiling that will bind constantly at the next step. A pilot passed through quickly proves that a rate is achievable once; a held step proves it is sustainable, which is the actual question.
How do we secure supplier capacity for the ramp?
Capacity reservation agreements, where suppliers hold volume for you in exchange for purchase commitments — and engaging procurement early enough for those to be negotiated rather than requested. Supply-chain readiness is where most scale-up programmes stall, and it is almost always because procurement was brought in too late to do anything but ask. Alongside the commercial mechanism, validate organisational readiness: sub-tier supplier management, quality systems, asset management and the supplier's ability to invest in supporting future demand.
What is the fastest useful first step?
Compute the six ceilings from data you already hold — gate transactions, door hours by tier, yard positions, shunt productivity, rack capacity and container pool cycle. It takes a fortnight, needs no system change, and typically identifies the binding constraint and the step at which it binds before any capital is committed. Most of the value in ramp readiness comes from knowing which ceiling to defend rather than from defending all of them. Our
integrations overview covers the data sources.
Model the Ceilings, Not Just the Curve
Six logistics ceilings computed against the target rate at eighty per cent rather than a hundred, supplier logistics verified at cadence alongside production, one held pilot step that proves sustainability, and contingency triggers with authorisers already named.
Uses existing gate, dock and yard data · No line changes required · Site-level configuration
August 17, 2026By Alex Rowan
All Blogs