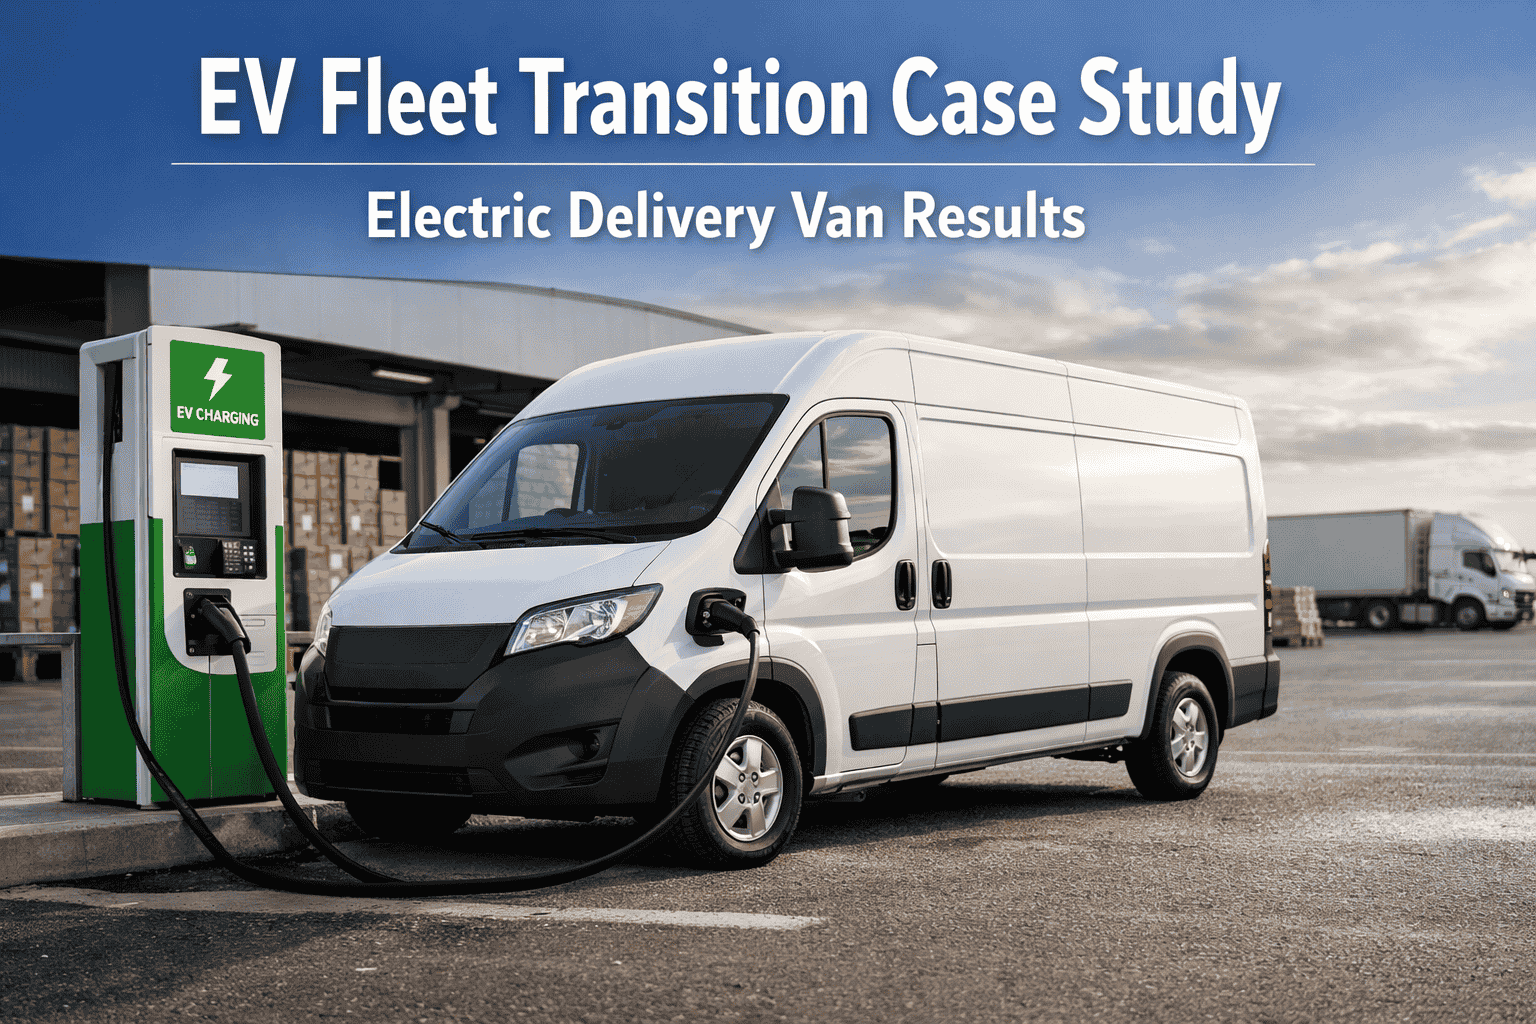
Most fleet managers evaluating EV transition get stuck at the same point: the business case looks compelling on paper, but the operational risk feels enormous. What happens when a driver runs low on charge mid-route? What if the charging infrastructure costs more than the fuel savings? What if half the drivers quit? This case study answers every one of those questions with 18 months of real data from a regional delivery fleet that made the full transition 80 vans, zero missed deliveries, $680,000 in annual savings. Book a demo to see how FleetRabbit manages EV fleet transitions.
How a Delivery Fleet Saved $680K Transitioning 80 Vans to Electric
18 months. 80 vehicles. Zero missed deliveries. Zero tailpipe emissions. Here's the complete implementation story.
Metro Parcel Direct
Regional parcel and last-mile delivery operator serving a major US metro service area
The Problem That Started the Conversation
Metro Parcel Direct's fleet operations director had been watching fuel costs climb for three straight years. At $1.2M annually across 80 vans — with diesel prices showing no sign of stabilizing — the question shifted from "should we look at EVs?" to "how long can we afford not to?" But the operational concerns were just as real as the financial ones.
Fuel Costs Eating Margins
Diesel spend at $1.2M annually represented 28% of total operating cost. With margins already thin in last-mile delivery, every price spike at the pump directly impacted profitability.
High Maintenance Burden
80 diesel vans requiring oil changes every 5,000 miles, brake jobs, transmission service, and exhaust repairs consumed $340K annually in maintenance spend and took vehicles off-route for service days.
ESG Pressure Growing
Two of the company's three largest clients had added zero-emission delivery requirements to their contract renewal terms. Staying diesel was becoming a contract retention risk, not just an environmental preference.
Operational Transition Fear
Range anxiety, charging infrastructure complexity, driver resistance, and the risk of disrupting delivery operations during a multi-quarter transition were the reasons the EV discussion had been deferred for two years.
We knew the numbers made sense. What we didn't know was whether we could actually execute the transition without disrupting operations. That was the question FleetRabbit answered for us — before we ordered a single vehicle.
Solution: FleetRabbit EV Transition Platform
Before a single van was ordered, FleetRabbit ran a full EV suitability analysis across all 80 vehicles — scoring each route against range, duty cycle, depot return pattern, and weather exposure. The results validated what the operations director suspected: the fleet was an ideal EV candidate. Book a demo to run your fleet's suitability analysis.
Platform Modules Deployed
Planning an EV Transition? Start With the Analysis.
FleetRabbit's suitability scoring tells you which vehicles are ready — and which routes need a different plan — before you commit capital.
Implementation: 20 Vehicles Per Quarter, 4 Phases
The transition was deliberately phased at 20 vehicles per quarter — fast enough to build operational knowledge, slow enough to catch and fix problems before they scaled. Here's how each phase played out.
Pilot — Best Routes, Volunteer Drivers
Months 1–4 · 20 vehiclesScale-Up — Peer Coaching, Mixed Fleet Visibility
Months 5–8 · Vans 21–40Winter Readiness — Cold Weather Protocol Activated
Months 9–13 · Vans 41–60 · First Full Winter100% Electric — Final 20 Vans, Last Diesel Retired
Months 14–18 · Vans 61–80 · Full EV Fleet18-Month Results
Here is the complete breakdown of what Metro Parcel Direct achieved across 18 months with FleetRabbit's EV transition platform. Sign up free to start tracking your own EV transition results.
Total Savings Summary — 18-Month EV Transition
Driver Adoption: What Actually Happened
Driver resistance was the concern that came up most often in the pre-transition planning phase. Here's what the data showed 90 days after the full fleet went electric.
"I was skeptical. I've been driving diesel for 11 years. But after the first week, I stopped worrying about range — I could see exactly how much I had left in the app. And no more stopping for fuel. That alone saves me 20 minutes a day."
Driver Satisfaction Survey — 90 Days Post-Transition
How FleetRabbit Managed the Driver Transition
Real Range Data in the App
Drivers see live remaining range, projected end-of-route SoC, and nearest charging option in the FleetRabbit driver app — replacing anxiety with actual data.
Peer Coaching Over Manager Training
Phase 1 drivers coached Phase 2 drivers. Hearing "I stopped worrying about range in week 3" from a colleague landed more effectively than any formal training.
Automatic Cold Weather Alerts
On cold days, drivers receive a morning briefing in the app with adjusted range estimate, pre-conditioning status, and any route modifications — no guesswork required.
No Fuel Stop Time Lost
Overnight charging at the depot means drivers start every shift at full charge. The 15–20 minutes previously lost to fuel stops per shift was recovered as productive route time.
Before EV vs. After EV — Full Comparison
A side-by-side view of how operations changed after the transition to a fully electric fleet.
Frequently Asked Questions
Is $680K realistic for an 80-van fleet?+
The $680K figure reflects this fleet's specific operating conditions: urban routes averaging 85 miles per day, electricity at $0.048/mile versus diesel at $0.21/mile, with smart charging reducing demand charges by $28K annually. Your fleet's savings will vary based on local electricity rates, fuel costs, and route profiles. FleetRabbit's EV transition assessment models your specific numbers — not industry averages — before you commit to any vehicles.
What's the ideal daily mileage for EV van viability?+
Urban delivery vans under 100 miles per day with overnight depot return are the strongest EV transition candidates. The 85-mile average in this case study sits comfortably inside that window with a 43% range buffer built in. The critical threshold isn't just daily mileage — it's daily mileage plus a 20–30% margin for weather, payload variation, and occasional route deviation. FleetRabbit's suitability scoring models this buffer per vehicle using actual route data, not manufacturer range claims. Run your free fleet suitability score →
How did you handle charging infrastructure costs?+
Metro Parcel Direct invested $359,000 in charging infrastructure gross ($165K for 76 Level 2 chargers, $152K for 4 DC fast chargers, $42K for panel upgrades) — reduced to $291,000 net after $68,000 in state utility make-ready rebates. FleetRabbit's load management software avoided an estimated $28,000 in annual demand charges by staggering charging start times across the depot. The net infrastructure investment was recovered in under 6 months from combined fuel and maintenance savings.
What happened to battery health over 18 months?+
After 18 months and an average of 312 full charge cycles per vehicle, the fleet's average battery state of health is 96.2% — compared to the manufacturer's expected 94% at this cycle count. FleetRabbit's charging management is credited with the outperformance: by limiting frequent fast-charge use to genuine operational need and maintaining optimal daily charge windows (20–80% for routine operation, 95% only for winter protocols), thermal stress on battery cells has been minimized. Every vehicle's SoH is tracked individually in the FleetRabbit dashboard.
What if our fleet is smaller than 80 vans?+
FleetRabbit supports EV fleet transitions from 5 vehicles to 500+. Smaller fleets often see higher percentage ROI because the operational baseline is more inefficient and the per-vehicle improvement is more impactful. The same platform — suitability scoring, charging management, battery monitoring, driver coaching, and mixed-fleet dashboard — scales to any fleet size. Book a demo to see how it works for your fleet size.
Ready to Make the EV Business Case for Your Fleet?
Start with FleetRabbit's free EV suitability assessment — route analysis, infrastructure planning, incentive identification, and a real savings projection based on your actual fleet data.
Free for up to 3 vehicles · EV suitability report in 48 hours · US, AU, UK, CA fleets supported