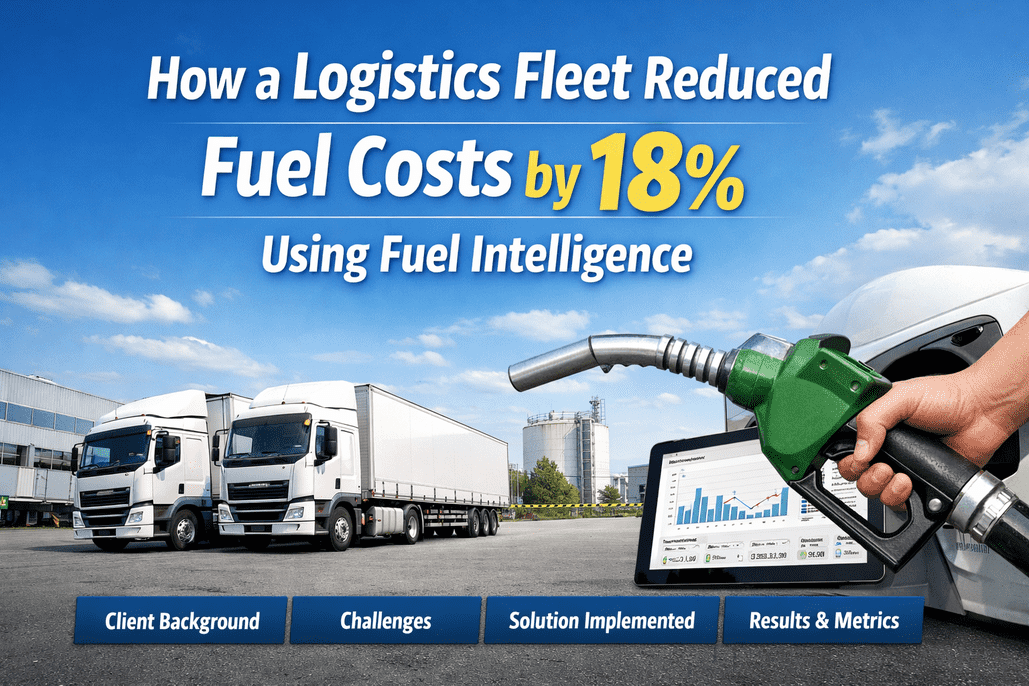
Discover how a mid-sized logistics fleet achieved 18% fuel cost reduction using fuel intelligence and data-driven monitoring strategies—real results, proven methods, and measurable ROI. This case study explores practical approaches to fuel optimization including consumption analytics, oil monitoring, and driver behavior insights that transformed their largest expense into a competitive advantage. Learn how systematic fuel intelligence delivered $847K annual savings with a 6-month payback period.
18%
Fuel Cost Reduction
$847K
Annual Savings
6 Months
Payback Period
496%
First-Year ROI
Fuel costs represent up to 40% of total fleet operating expenses, making fuel optimization the single greatest opportunity for improving profitability. This case study examines how Midwest Express Logistics—a 185-vehicle regional carrier—implemented a comprehensive fuel intelligence system that delivered measurable results within 90 days. Their approach combining telematics integration, fuel card monitoring, driver coaching, and predictive analytics provides a replicable blueprint for fleets seeking to control their largest variable expense.
Client Background: Midwest Express Logistics
Before implementing fuel intelligence, Midwest Express Logistics operated with limited visibility into their fuel consumption patterns, relying on aggregate monthly totals that masked significant inefficiencies across their fleet.
Company Profile
Midwest Express Logistics is a regional carrier operating 185 trucks across 6 Midwestern states, specializing in temperature-controlled freight and LTL distribution for retail and food service clients. Their mixed fleet includes 120 Class 8 tractors, 45 straight trucks, and 20 refrigerated units covering 8.2 million miles annually with pre-implementation fuel costs exceeding $4.7M—representing 32% of total operating expenses.
Fleet Profile Overview
| Category | Details | Annual Impact |
|---|---|---|
| Fleet Size | 185 vehicles (mixed fleet) | 8.2M miles annually |
| Vehicle Types | Class 8 tractors, straight trucks, reefers | Varied fuel efficiency profiles |
| Service Area | 6 Midwestern states | Regional distribution network |
| Pre-Implementation Fuel Spend | $4.7M annually | 32% of operating costs |
| Average Fleet MPG | 6.1 MPG | Below industry benchmark |
The Challenges: Hidden Fuel Waste
Midwest Express faced mounting pressure from multiple directions that threatened profitability and operational sustainability. Without granular visibility into fuel consumption, management couldn't identify root causes or prioritize improvements.
Key Challenges Identified
- Blind Spots in Consumption: No visibility into individual vehicle or driver fuel performance—only aggregate monthly totals
- Excessive Idle Time: Fleet averaged 28% idle time versus industry benchmark of 15%, wasting approximately 180,000 gallons annually
- Inconsistent Driver Behavior: Wide MPG variation across similar routes suggested technique issues, but no data for coaching
- Fuel Card Fraud Concerns: Suspected unauthorized purchases estimated at 3-5% of fuel spend with no verification system
- Reactive Maintenance: No correlation between vehicle health and fuel efficiency, missing early warning signs
Pre-Implementation Performance Baseline
| Metric | Midwest Express | Industry Benchmark | Gap |
|---|---|---|---|
| Fleet Average MPG | 6.1 MPG | 7.0+ MPG | -13% |
| Idle Time Percentage | 28% | 15% | +87% |
| Fuel Cost Per Mile | $0.58 | $0.48 | +21% |
| Fuel Shrinkage Rate | ~4.2% | <1% | +320% |
Is your fleet facing similar fuel challenges? Sign up for Fleet Rabbit free to identify your optimization opportunities.
Solution Implemented: Comprehensive Fuel Intelligence
Midwest Express deployed an integrated fuel intelligence platform combining real-time telematics, fuel card monitoring, analytics dashboards, and driver engagement tools to create complete visibility and actionable insights.
Implementation Approach
The 12-week phased implementation ensured minimal operational disruption while building organizational capability. Each phase delivered measurable quick wins that generated buy-in for subsequent initiatives, creating a foundation for sustained improvement rather than one-time gains.
Implementation Timeline
| Phase | Timeline | Activities | Quick Wins |
|---|---|---|---|
| Phase 1: Foundation | Weeks 1-4 | Telematics installation, fuel card integration, baseline metrics | Visibility into consumption patterns |
| Phase 2: Analytics | Weeks 5-8 | Dashboard configuration, alert setup, anomaly detection | Identified top 20 fuel waste sources |
| Phase 3: Engagement | Weeks 9-12 | Driver scorecards, coaching programs, incentive launch | 15% idle reduction in first month |
| Phase 4: Optimization | Ongoing | Route optimization, predictive maintenance, continuous improvement | Sustained 18% cost reduction |
Technology Components Deployed
Telematics Integration
Function: Real-time GPS and engine data
Data Captured: Location, speed, idle time, MPG
Coverage: 100% of fleet vehicles
Update Frequency: Every 30 seconds
Fuel Card Monitoring
Function: Transaction verification
Data Captured: Location, amount, vehicle match
Fraud Detection: Real-time alerts
Integration: Automatic reconciliation
Analytics Dashboard
Function: KPI visualization
Views: Fleet, vehicle, driver, route
Alerts: Threshold-based notifications
Reports: Automated weekly summaries
Build Your Fuel Intelligence System
Get a customized implementation roadmap based on Midwest Express's proven approach for your fleet size and operations.
Get Started Free →Results & Metrics: Measurable Impact
The fuel intelligence implementation delivered results exceeding initial projections, with measurable improvements visible within 30 days and full ROI achieved in 6 months.
7.2 MPG
New Fleet Average (+18%)
12%
New Idle Rate (-57%)
$0.47
Cost Per Mile (-19%)
0.3%
Shrinkage Rate (-93%)
Before vs. After Comparison
| Performance Metric | Before | After | Improvement | Annual Savings |
|---|---|---|---|---|
| Fleet Average MPG | 6.1 MPG | 7.2 MPG | +18% | $412K |
| Idle Time Percentage | 28% | 12% | -57% | $322K |
| Fuel Cost Per Mile | $0.58 | $0.47 | -19% | $738K |
| Annual Fuel Spend | $4.7M | $3.85M | -18% | $847K |
| Fuel Shrinkage/Fraud | ~4.2% | 0.3% | -93% | $161K |
| Total Annual Impact | - | - | - | $847K saved |
Savings Breakdown by Category
| Savings Category | Annual Amount | % of Total | Primary Driver |
|---|---|---|---|
| Idle Time Reduction | $322,000 | 38% | Automated idle alerts and driver coaching |
| Driver Behavior Improvement | $246,000 | 29% | Scorecards, training, incentive programs |
| Fraud Prevention | $161,000 | 19% | Fuel card verification and location matching |
| Maintenance Optimization | $118,000 | 14% | Proactive service based on efficiency data |
| Total Annual Savings | $847,000 | 100% | Integrated fuel intelligence |
ROI Analysis
- Total Implementation Cost: $142,000 (hardware, software, training, integration)
- Annual Ongoing Cost: $48,000 (subscriptions, maintenance, incentives)
- First Year Net Savings: $657,000 ($847K savings - $142K implementation - $48K ongoing)
- First Year ROI: 496% return on investment
- Payback Period: 6 months to full cost recovery
- 5-Year Projected Savings: $4.0M+ with continuous improvement
Want to achieve similar results for your fleet? Book a free consultation with our fuel optimization experts.
Key Takeaways: Lessons for Your Fleet
The success of Midwest Express's fuel intelligence implementation offers valuable lessons for fleets of all sizes seeking to optimize their fuel operations.
Critical Success Factors
- Data Creates Accountability: Once drivers and managers could see actual performance data, behavior changed rapidly—visibility alone drove 40% of improvement before incentive programs launched
- Quick Wins Build Momentum: Targeting idle reduction first delivered immediate results that generated buy-in for broader initiatives—measurable savings within 30 days
- Driver Engagement is Essential: Gamification and incentives transformed drivers from skeptics to champions—top performers earned $200-400 monthly in fuel efficiency bonuses
- Integration Multiplies Value: Connecting fuel cards with telematics eliminated blind spots—combined data revealed patterns neither system could identify alone
- Continuous Improvement Sustains Results: Monthly reviews and ongoing optimization prevented backsliding and identified new opportunities
Implementation Best Practices
Start with Visibility
Priority: Establish baseline metrics first
Timeline: Weeks 1-4
Expected Result: Clear problem identification
Success Metric: 100% fleet coverage
Target High-Impact Areas
Priority: Focus on biggest waste sources
Timeline: Weeks 5-8
Expected Result: Quick ROI demonstration
Success Metric: 5-10% savings in 30 days
Engage Your Drivers
Priority: Make it about rewards, not punishment
Timeline: Weeks 9-12
Expected Result: Sustained behavior change
Success Metric: 90%+ driver adoption
Common Pitfalls to Avoid
- Data Overload: Focus on 5-7 key metrics initially—too many dashboards leads to analysis paralysis
- Punitive Approach: Using data to punish drivers creates resistance—frame as coaching and reward opportunity
- One-Time Implementation: Without ongoing reviews, gains erode—schedule monthly optimization sessions
- Siloed Systems: Disconnected data sources hide patterns—ensure full integration between platforms
- Ignoring Maintenance: Mechanical issues affect fuel efficiency—include vehicle health in your analytics
Ready to implement these best practices? Get started with Fleet Rabbit and start optimizing your fuel costs today.
Your Path to Fuel Savings
Based on this case study and industry benchmarks, most fleets can achieve 15-25% fuel savings within 12 months through comprehensive optimization programs.
Expected Results Timeline
| Timeframe | Expected Savings | Primary Drivers | Key Actions |
|---|---|---|---|
| 30 Days | 5-10% | Idle reduction, basic monitoring | Deploy telematics, set up alerts |
| 90 Days | 10-15% | Driver coaching, fraud prevention | Launch scorecards and incentives |
| 6 Months | 15-20% | Full program implementation | Achieve ROI, sustain improvements |
| 12 Months | 18-25% | Continuous optimization culture | Expand to advanced analytics |
Industry Benchmarks for Fuel Optimization
According to industry research, telematics systems deliver 300-500% ROI within 12 months. Fleets using data-driven strategies report operational cost reductions of up to 18% in their first year. The U.S. Department of Energy reports that aggressive driving behavior can lower fuel economy by 15-30%, while proper tire inflation alone improves efficiency by up to 3%. These factors combined represent significant savings potential for any fleet willing to invest in visibility and driver engagement.
Don't let fuel waste drain your profits. Schedule a demo to see how Fleet Rabbit can help your fleet achieve similar results.
Conclusion: Transform Your Largest Expense
Midwest Express Logistics' fuel intelligence implementation demonstrates that significant fuel savings are achievable for any fleet willing to invest in visibility, analytics, and driver engagement. Their 18% cost reduction—representing $847,000 in annual savings—was achieved through systematic application of proven strategies rather than dramatic operational changes.
Key Takeaways for Fleet Executives
- Fuel intelligence delivers measurable ROI—496% first-year return with 6-month payback
- Visibility creates accountability—data drives behavior change before incentives even launch
- Driver engagement is essential—make it about rewards, not surveillance
- Integration multiplies value—connected systems reveal patterns single solutions miss
- Quick wins build momentum—target idle reduction for immediate results
- Continuous improvement sustains gains—monthly reviews prevent backsliding
The path to fuel optimization is clear: establish baseline visibility, target high-impact waste sources, engage drivers with positive incentives, and maintain focus on continuous improvement. Fleets that treat fuel intelligence as a strategic capability—rather than a one-time project—will continue finding new opportunities for savings while competitors struggle with rising costs.
Your fleet's fuel costs represent both your largest controllable expense and your biggest opportunity for improved profitability. The question isn't whether fuel intelligence will deliver results—the data proves it will. The question is how quickly you'll capture those savings for your operation.
Ready to Reduce Your Fuel Costs by 18%?
Join fleet leaders achieving significant fuel savings through data-driven fuel intelligence. Get your customized assessment and implementation roadmap today.