See how a 75-vehicle delivery fleet gained complete visibility into fuel spending, eliminated waste, and achieved 23% cost reduction using data-driven fuel analytics. This case study reveals the tracking strategies, behavior insights, and ROI metrics that transformed their operations.
Client Background: Metro Fresh Delivery
Metro Fresh Delivery operates a fleet of 75 medium-duty delivery trucks serving grocery chains, restaurants, and food distributors across a 6-state Midwest region. With routes spanning urban centers to rural communities, the company faced mounting pressure from rising fuel costs that threatened their competitive pricing model.
The Challenges: Invisible Fuel Drain
Before implementing fuel analytics, Metro Fresh operated with minimal visibility into where their $814,000 annual fuel budget actually went. Management knew costs were climbing, but couldn't identify the specific causes or take targeted action.
Zero Spending Visibility
Fuel purchases tracked only by total monthly spend—no insight into per-vehicle, per-route, or per-driver consumption patterns
Excessive Idle Time
Drivers averaging 2.3 hours daily idling during deliveries, loading, and breaks—burning fuel with zero productive miles
Suspected Fuel Theft
Unexplained fuel variances of 8-12% monthly between purchases and calculated consumption, with no way to investigate
Inefficient Driver Behaviors
No data on speeding, harsh braking, or rapid acceleration—behaviors known to impact fuel economy by up to 30%
"We were spending over $800K annually on fuel but couldn't tell you why Route 12 cost twice as much as Route 7. It was like flying blind with our biggest controllable expense."
The Problem: Why Traditional Tracking Failed
Metro Fresh relied on fuel card statements and monthly totals—a reactive approach that revealed problems only after thousands were already wasted. Industry research confirms this challenge is widespread:
of fleet operating budgets go to fuel—the largest controllable expense for most fleets
of annual fuel consumption lost to theft, fraud, or unauthorized usage without monitoring
annual fuel waste per vehicle from excessive idling alone—often invisible without tracking
Fleet managers using comprehensive monitoring systems report 78% average theft reduction within the first year, with ROI typically achieved in 4-6 months.
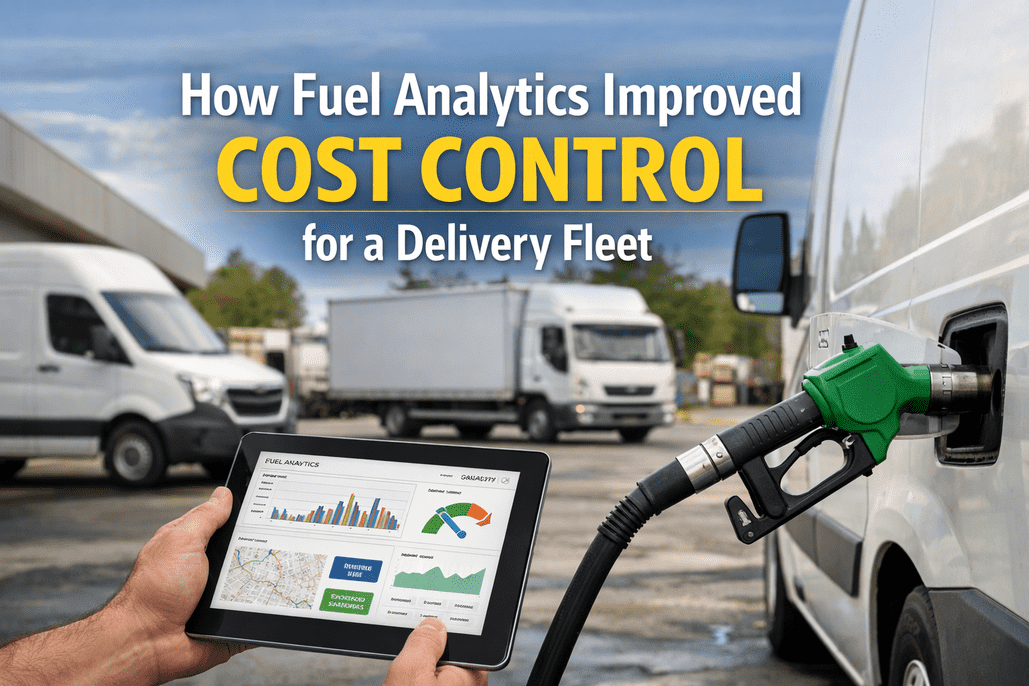
The Solution: Data-Driven Fuel Intelligence
Metro Fresh implemented FleetRabbit's fuel analytics platform, establishing a comprehensive monitoring framework that transformed raw data into actionable insights. See how this works for your fleet →
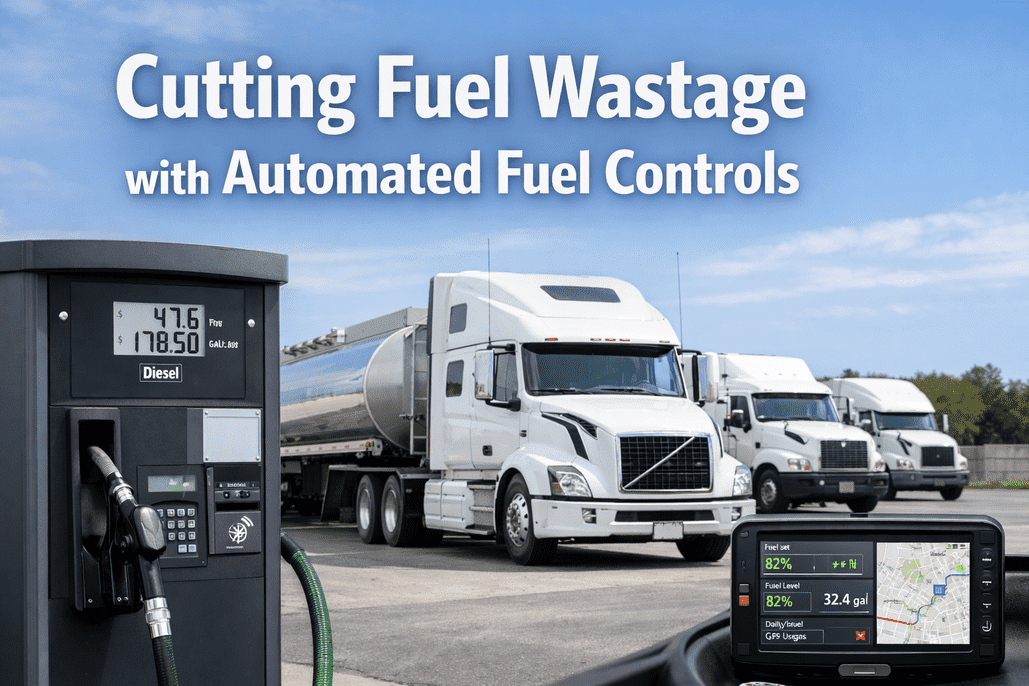
Real-Time Consumption Tracking
GPS-linked fuel sensors monitoring tank levels every 30 seconds, automatically flagging anomalies like unexpected drops or fill-ups at unauthorized locations
Driver Behavior Scoring
Continuous monitoring of speeding, acceleration, braking, and idle time—with weekly scorecards ranking drivers and highlighting coaching opportunities
Route Efficiency Analysis
AI-powered comparison of planned vs. actual routes, identifying unnecessary miles, traffic inefficiencies, and fuel-wasting deviations
Automated Alerts & Reports
Instant notifications for theft indicators, daily idle summaries, and weekly cost-per-mile breakdowns by vehicle, route, and driver
Real Detection: Catching Waste in Action
Within the first 60 days, fuel analytics uncovered multiple sources of hidden fuel drain that had gone undetected for years:
Discovery Timeline
17 drivers averaging 2+ hours daily idle identified—$4,200/month in wasted fuel
3 vehicles showing suspicious after-hours fuel drops; investigation confirmed siphoning
12% of daily miles identified as unnecessary—drivers taking personal detours
Top 10 vs. bottom 10 drivers showed 31% MPG difference—targeted coaching began
First 60-Day Impact
Results: Measurable Impact Across Operations
After 12 months of data-driven fuel management, Metro Fresh achieved transformational improvements in cost control and operational efficiency:
Fuel Cost Reduction
From $814K to $627K annually
Idle Time Reduction
From 2.3 to 1.3 hours daily
Theft Elimination
Variances: 10% to 1.3%
MPG Improvement
Fleet avg: 7.2 to 8.5 MPG
12-Month Financial Impact Analysis
Swipe to see full table
| Category | Before | After | Annual Savings |
|---|---|---|---|
| Idle Fuel Waste | $97,200/year | $56,400/year | $40,800 |
| Fuel Theft/Fraud | $81,400/year | $10,600/year | $70,800 |
| Route Inefficiency | $48,800/year | $19,500/year | $29,300 |
| Driver Behavior Impact | $122,100/year | $76,000/year | $46,100 |
| Total Annual Benefit | $187,000 | ||
Key Takeaways for Fleet Managers
Visibility Creates Accountability
Simply measuring idle time reduced it by 42%—drivers changed behavior once they knew it was tracked and scored
Theft Is Often Hidden in Plain Sight
10% fuel variances seemed "normal" until analytics proved 87% of losses were preventable theft and fraud
Driver Coaching Delivers Fast ROI
Top performers showed 31% better MPG—targeted coaching closed the gap within 90 days
Daily Tracking Beats Monthly Reports
Real-time alerts caught $6,200 in theft within 3 weeks—monthly reviews would have missed it entirely
Implementation Timeline
Metro Fresh achieved full deployment and measurable results in just 12 weeks:
Setup & Integration
Sensor installation, fuel card integration, baseline data
Configuration
Dashboard setup, alert thresholds, driver scorecards
Active Monitoring
Coaching sessions, policy enforcement, investigations
Optimization
Route refinement, continuous improvement, full ROI
Ready to See Where Your Fuel Budget Really Goes?
Join hundreds of fleets using data-driven fuel analytics to eliminate waste, prevent theft, and take control of their biggest variable expense.
No credit card required • See results within 60 days • Cancel anytime