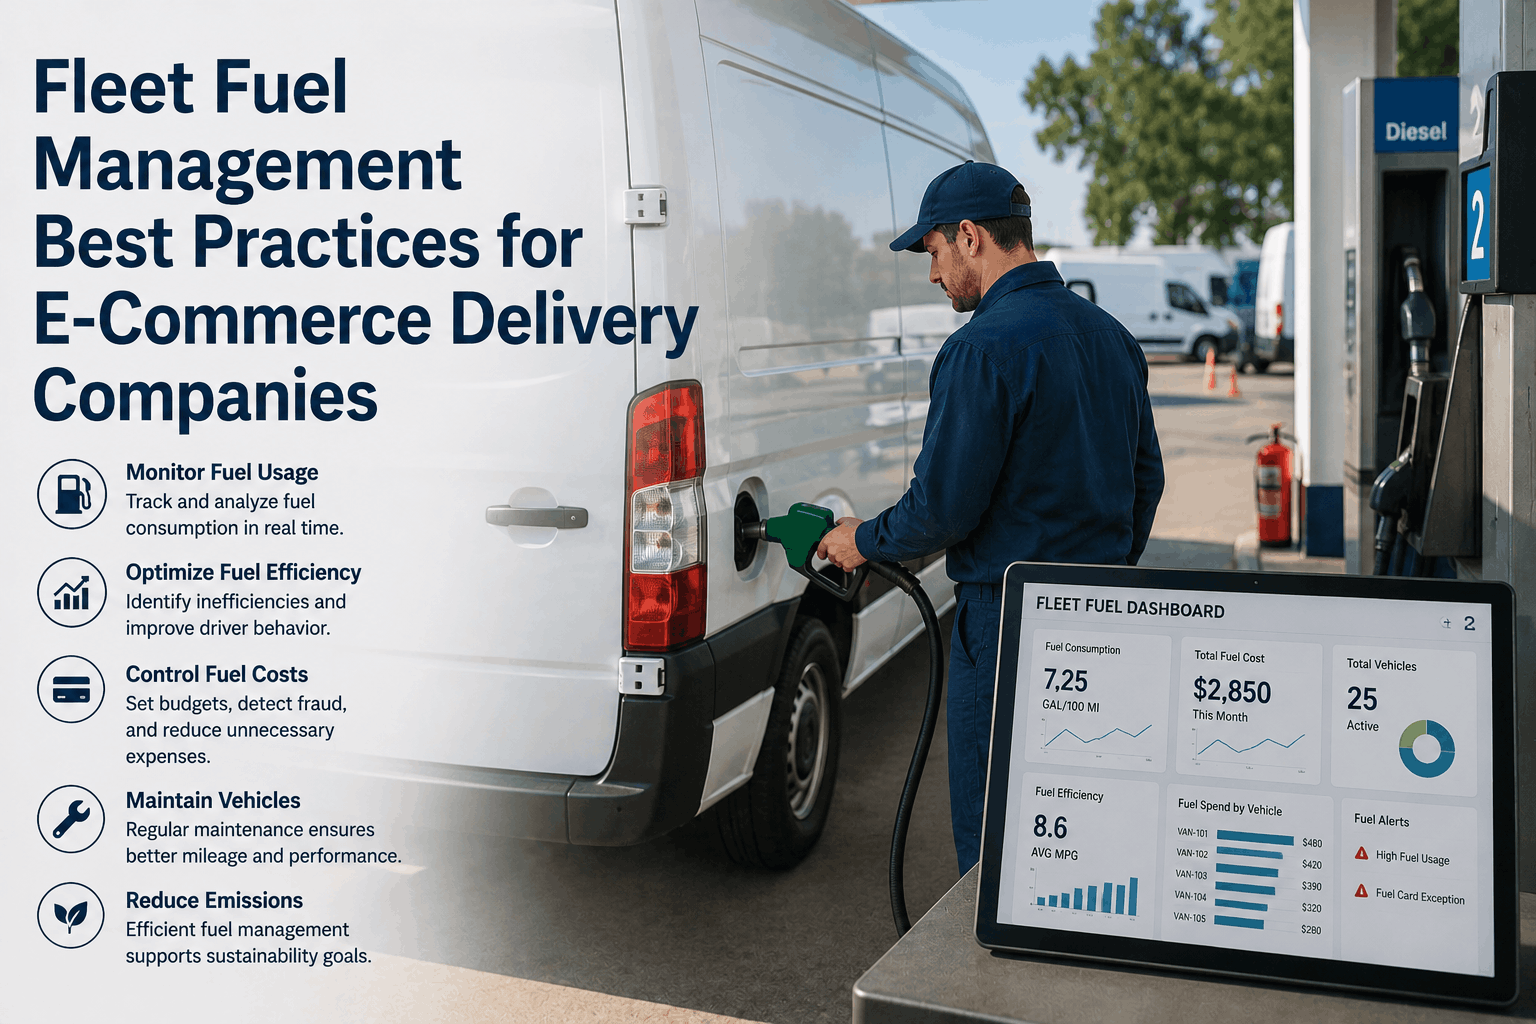
Fuel is the single largest variable cost in e-commerce last-mile delivery — representing 28–35% of total operating expense per vehicle, and the cost category most vulnerable to waste, theft, and mismanagement. For every $100 spent running a delivery fleet in the US, $28–35 goes to fuel — yet most operators lack real-time visibility to know how much is generating deliveries versus idling, leaking through theft, or burning away in preventable aggressive driving. Fleet fuel management software changes that with GPS-integrated monitoring, consumption analytics by driver and route, theft detection alerts, and MPG optimization that together cut fuel cost 22–30%. Fleet Rabbit's platform gives US e-commerce operators the complete visibility stack — real-time tracking, driver behavior scoring, idle monitoring, and route optimization — purpose-built to eliminate the biggest sources of fuel waste in last-mile delivery. Book a demo to see Fleet Rabbit's fuel management applied to your delivery fleet.
Quick Answer
Fleet fuel management best practices for e-commerce delivery companies cover six core areas: real-time consumption monitoring by vehicle and driver, idle time reduction through alerts and coaching, fuel theft detection via GPS cross-referencing, MPG improvement through driver behavior programs, preventive maintenance scheduling to avoid fuel-wasting mechanical degradation, and vehicle-to-delivery matching to reduce fuel burned per stop. US e-commerce fleets using Fleet Rabbit reduce total fuel cost 22–30%, cut idle waste 30–40%, and detect theft within hours — with full ROI typically achieved within 45–60 days.
Practice #1: Real-Time Fuel Consumption Monitoring by Vehicle and Driver
You cannot manage what you cannot measure. The foundation of fleet fuel management is continuous, granular visibility into how much fuel each vehicle burns — and whether that fuel is generating deliveries or being wasted. Manual tracking via receipts and odometer logs arrives too late to prevent the waste it documents.
What Real-Time Monitoring Reveals
GPS-integrated fuel sensors report consumption continuously — showing consumption rate per mile, idle-hour fuel burn, and per-driver MPG deviation from fleet average. Fleets switching from manual logging discover 8–14% of total fuel spend was unaccounted for — through theft, odometer padding, or systematic mileage over-reporting.
Cost Variance Analysis by Driver
A 50-vehicle fleet with drivers averaging 18 MPG versus an optimized 21 MPG burns 16.7% more fuel for identical delivery volume. At $3.80/gallon and 180 miles/day, that gap costs $1.43/vehicle/day — over $26,000 annually across the fleet. Driver-level MPG scorecards identify the highest-cost outliers for targeted coaching before variance compounds.
Route-Level Consumption Benchmarking
Routes through dense urban areas — downtown LA, Chicago Loop, Manhattan — consume 35–50% more fuel per mile than suburban routes due to stop-and-go traffic. Benchmarking by route identifies where traffic-avoidance rerouting delivers the highest fuel savings versus where vehicle type changes make economic sense.
Practice #2: Idle Time Reduction — Eliminate the Biggest Hidden Fuel Drain
Idling is the most overlooked fuel cost in last-mile operations. A delivery van running at idle burns 0.8–1.2 gallons per hour with zero delivery progress. At $3.80/gallon, that's $3.00–$4.56 per idle hour per vehicle — adding up to $2,200–$4,100 per vehicle annually on US urban routes.
1
Automated Idle Alerts — Stop Waste in Real Time
Fleet Rabbit triggers idle alerts when a vehicle engine runs more than 3–5 minutes without movement — notifying the driver via cab alert and dispatcher via dashboard. Automated alerts reduce idle incidents 35–50% within two weeks because drivers modify behavior when idle events are recorded and reviewed.
Dallas e-commerce operator, 32 vehicles. Pre-deployment idle: 47 min/vehicle/day. Post-alert (Week 3): 19 min/vehicle/day. Saving: 28 min × 1.0 gal/hr × $3.80 × 32 vehicles × 250 days = $14,288 annually from idle reduction alone.
2
Structural Idle vs. Behavior Idle — Different Solutions
Fleet Rabbit's idle analytics separate behavior-driven idle (drivers leaving engines running) from structural idle (congested corridors forcing extended stops). Behavior idle is solved through coaching and alerts. Structural idle requires route redesign — shifting deliveries to off-peak windows or rerouting around chronically congested corridors.
Behavior idle: alerts + coachingStructural idle: route redesignCombined reduction: 30–40%
3
Idle Policy Enforcement Through Data
Idle reduction programs fail without accountability data. Fleet Rabbit generates weekly idle reports by driver — showing total idle hours, events by location, and trend versus prior week. Managers who cite specific events ("your idle increased 23 minutes at the Kroger zone on Route 5") drive faster behavior change than those delivering general reminders.
Target benchmark for US urban delivery: under 15% of total engine-on time. Fleets above 25% idle rate have a measurable fuel waste problem solvable with Fleet Rabbit monitoring.
Fuel Monitoring + Idle Management
Cut Fleet Fuel Waste 22–30% — Starting Week One of Deployment
Fleet Rabbit's fuel management platform combines real-time consumption tracking, automated idle alerts, and driver behavior scoring to identify and eliminate the biggest sources of fuel waste across your US delivery fleet.
30–40%
Idle Fuel Reduction
Practices #3–6: Theft Prevention, MPG Optimization, Maintenance, and Load Matching
Beyond idle reduction, four additional fuel management practices account for 40–55% of recoverable fuel cost in US e-commerce delivery operations.
Practice #3: Fuel Theft Detection — GPS Cross-Reference Catches Unauthorized Fill-Ups
The scale: The American Transportation Research Institute estimates fuel theft costs US commercial fleets $3–4 billion annually. Common patterns include card skimming, driver overfill and siphoning, and unauthorized personal use of fleet fuel cards outside working hours.
How Fleet Rabbit detects it: Every fuel transaction is cross-referenced against GPS vehicle position at transaction time. A charge at a Phoenix station while the vehicle's GPS shows it parked 8 miles away triggers an instant alert. Out-of-zone fills, after-hours transactions, and quantities exceeding tank capacity all fire automated alerts.
Outcome: GPS-integrated fuel monitoring reduces theft-related fuel loss 60–80% within 60 days — the detection risk alone changes behavior before any theft is formally confirmed.
Practice #4: Driver Behavior Programs — Improve Fleet MPG 12–18%
The MPG gap: Aggressive driving — hard acceleration, sudden braking, speeds above 65 mph — reduces fuel efficiency 15–30% versus smooth operation on identical routes. The MPG gap between the top and bottom driver quartile on a 50-vehicle fleet often represents $35,000–$60,000 in annual fuel cost.
How Fleet Rabbit fixes it: Driver scorecards track harsh braking, aggressive acceleration, and speeding per shift — giving dispatchers specific coaching data. "Your aggressive acceleration on Tuesday's route cost $18 in excess fuel" drives faster change than general reminders.
US context: Highway segments common in Atlanta, Phoenix, Houston, and Dallas amplify speed-related MPG losses. Fleet Rabbit's geo-fenced speed monitoring identifies routes where speed coaching delivers the biggest fuel return.
Practice #5: Maintenance Scheduling — Degraded Vehicles Burn 8–15% More Fuel
The hidden fuel cost: Under-inflated tires increase consumption 0.5% per PSI below optimal. A van running 6 PSI low burns 3% more fuel than a properly maintained equivalent. Dirty air filters, worn oxygen sensors, and degraded engine oil produce compounding MPG losses of 8–15% that accumulate invisibly without monitoring.
How Fleet Rabbit prevents it: Engine fault code monitoring, mileage-based service scheduling, and TPMS integration ensure vehicles operate at peak fuel efficiency — with maintenance alerts triggered proactively before degradation impacts MPG or causes mid-route breakdowns.
Financial impact: A 10-vehicle fleet running consistently undermaintained vehicles wastes $4,200–$7,800 annually in excess fuel — before counting breakdown costs of $2,000–$4,500 per incident.
Practice #6: Vehicle-to-Delivery Matching — Right Vehicle for the Route
The mismatch cost: Dispatching a full-size cargo van to complete 8 deliveries in a dense urban core burns 2–3x the fuel of a compact delivery vehicle completing the same stops — and the van loses time to parking constraints that a smaller vehicle avoids. Vehicle-to-delivery mismatch is a systematic fuel waste most US fleets have never quantified.
How Fleet Rabbit optimizes it: Delivery volume and location density data drives vehicle assignment — compact vans for high-density urban zones (downtown Seattle, SF Mission District), full-size vehicles for suburban bulk routes. Matching vehicle size to delivery density improves fleet MPG 8–12% without changing driving behavior.
EV planning: Fleet Rabbit's consumption analytics identify which routes offer the strongest EV total cost of ownership advantage — enabling data-driven EV fleet expansion rather than guesswork.
Fleet Fuel Management ROI: The Combined Impact
22–30%
Total Fuel Cost Reduction
30–40%
Idle Fuel Waste Eliminated
60–80%
Theft-Related Loss Reduction
12–18%
MPG Improvement Per Driver
8–15%
Fuel Saved via Maintenance
45–60
Days to Full Platform ROI
Frequently Asked Questions: Fleet Fuel Management for US E-Commerce Delivery
QWhat hardware is required to monitor fuel consumption in real time?
Fleet Rabbit uses OBD-II telematics devices that plug into each vehicle's diagnostic port — no custom installation required. The device reads fuel consumption, engine fault codes, speed, GPS position, and idle status continuously. For fuel card cross-referencing, Fleet Rabbit integrates with WEX, Comdata, and Fleetcor to match transaction data against GPS position automatically. Full hardware installation across a 50-vehicle fleet typically takes one day, with data appearing in the dashboard within 24 hours of activation.
QHow do driver behavior scorecards work without creating labor relations issues?
Fleet Rabbit's scorecards are designed for coaching, not punishment — presenting weekly MPG performance, idle events, and driving behavior as data for improvement conversations. Best practice is a 30-day baseline period where data is collected but not acted on, so drivers understand their starting point. Fleets framing scorecards as "helping drivers save the company money" versus "catching drivers" see faster voluntary behavior improvement and measurable change within 2–3 weeks.
QDoes fuel management software work for mixed fleets including EVs?
Fleet Rabbit manages mixed fleets — gasoline vans, diesel cargo vehicles, CNG, and electric delivery vehicles — in a single dashboard. For EVs, the platform tracks kWh consumption per mile by route rather than gallons, enabling direct cost comparison between EV and ICE routes on a per-delivery basis. Charging session data, battery state of health, and range adequacy per route are all monitored to optimize EV deployment across the route network.
QWhat's the fastest way to reduce fuel costs before deploying full telematics?
The highest-impact immediate actions are idle policy enforcement (written policy with a defined 3-minute limit), tire pressure standardization (weekly checks recover 1–3% MPG immediately), and fuel card transaction review for after-hours or out-of-zone usage. These manual practices deliver 5–8% fuel savings without technology investment — and are the right starting point for fleets building the business case for a Fleet Rabbit deployment that compounds these gains into the full 22–30% reduction.
Related Fleet Rabbit Resources for E-Commerce Logistics
The four AI capabilities transforming e-commerce fleet operations — real-time GPS visibility, predictive vehicle health monitoring, dynamic route optimization, and delivery performance analytics — with ROI data for each.
AI-driven fault prediction and automated maintenance scheduling that prevents mid-route breakdowns — the vehicle reliability foundation that fuel efficiency depends on to function as planned.
How real-time utilization tracking, idle reduction analytics, and fleet right-sizing data reduce total fleet operating cost — directly applicable to delivery vehicle fuel management.
How GPS hardware, IoT vehicle data, and cloud analytics combine to deliver real-time fleet visibility, predictive maintenance, and fuel performance analytics — the technology behind every capability in this guide.
Cut Your Fleet Fuel Costs 22–30% — See Fleet Rabbit's Fuel Management in Action
Fleet Rabbit's fuel management platform delivers all six best practices through one integrated system — real-time consumption monitoring, idle reduction, theft detection, MPG improvement, preventive maintenance, and vehicle optimization working simultaneously across your entire US delivery fleet. Most operations recover full platform investment within 45–60 days through fuel savings alone.
22–30% Fuel Savings
30–40% Idle Reduction
60–80% Theft Loss Reduction
Real-Time Consumption Monitoring
45–60 Day ROI
May 25, 2026
By Lebron
All Posts