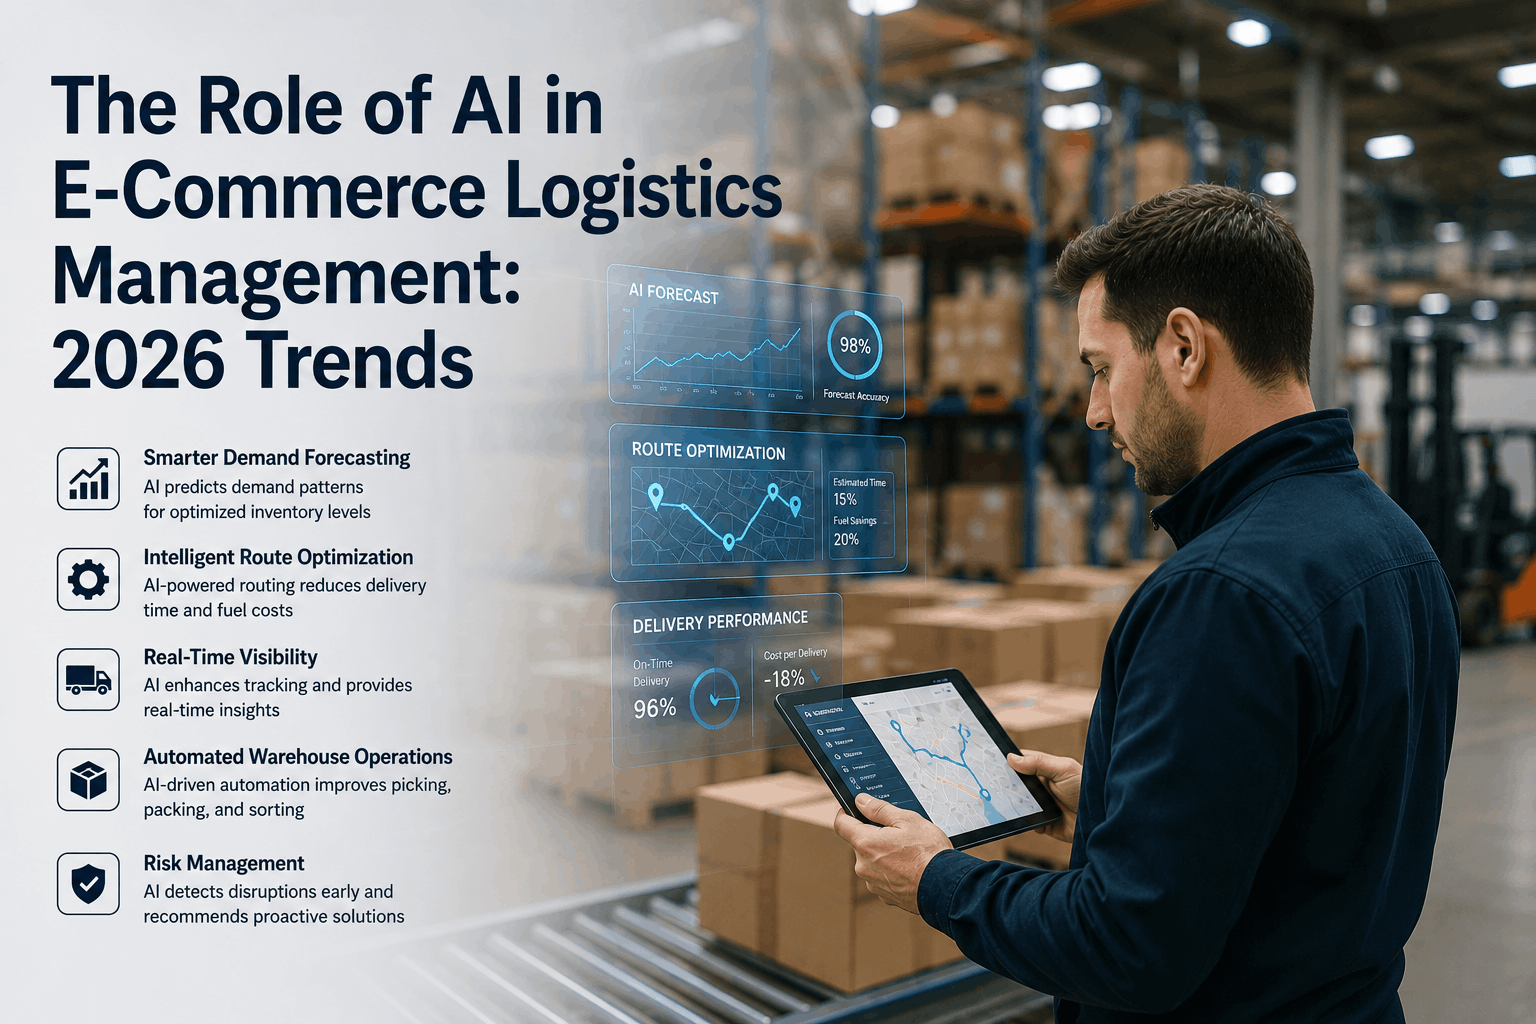
AI is rewriting the rules of e-commerce logistics in the US — not incrementally, but structurally. From same-day delivery windows that consumers in Seattle and Austin now consider standard, to predictive inventory systems that shift stock before demand spikes, artificial intelligence is compressing the gap between customer expectation and operational reality. US e-commerce logistics spend surpassed $285 billion in 2025, with last-mile costs still consuming 53% of that total. The brands gaining ground in 2026 aren't spending more — they're deploying AI to eliminate the inefficiencies that have always made last-mile delivery expensive. Fleet Rabbit's AI-powered platform brings these capabilities to mid-market and enterprise delivery fleets: intelligent routing, real-time fleet visibility, predictive maintenance, and delivery performance analytics in one system. Book a demo to see how Fleet Rabbit's AI works for your operation.
Quick Answer
In 2026, AI is transforming US e-commerce logistics across five critical dimensions: intelligent route optimization that cuts last-mile cost 18–25%, predictive demand forecasting that reduces inventory overstock 20–30%, AI-powered delivery scheduling that matches time windows to customer availability, real-time fleet visibility that enables dynamic exception response, and machine learning analytics that identify systemic TAT failures before they damage customer retention. Fleets deploying AI-driven platforms like Fleet Rabbit report 22–30% fuel savings, 28–35% fewer failed deliveries, and full ROI within 45–60 days of deployment.
Trend #1: AI Route Optimization Is Now Table Stakes for Competitive Last-Mile Delivery
Three years ago, AI-driven route optimization was a competitive advantage. In 2026, it's a baseline requirement for US e-commerce logistics operations competing on delivery speed and cost. Amazon's same-day delivery expansion across 50+ US metros has conditioned consumers to expect 2–4 hour delivery windows — a standard that's impossible to meet with manual dispatch and static route planning.
Dynamic Routing vs. Static Planning
Legacy dispatch builds routes at 6 AM and holds them through the day. AI routing rebuilds continuously — rerouting around the I-405 backup in LA, the construction closure in Chicago's loop, and the rain-delayed traffic in Houston — without dispatcher intervention. Real-time rerouting saves 12–18 minutes per route daily, creating capacity for 2–4 additional stops per vehicle per shift.
Measurable Cost Impact on US Fleets
A 40-vehicle delivery fleet operating in a metro like Phoenix or Dallas covers 150–200 km per vehicle daily. AI optimization producing a conservative 15% distance reduction saves 22–30 km/vehicle/day — at $0.18/km total operating cost, that's $158–$216/vehicle/day in savings. Annualized across 250 operating days: $1.58M–$2.16M for a 40-vehicle fleet from distance reduction alone.
Time-Window Matching at Scale
US residential delivery failure rates average 9–14% on first attempt — each failure costs $8–$12 in re-dispatch and redelivery. AI time-window matching assigns stops to route slots where predicted arrival aligns with customer availability patterns, reducing failed attempts 28–35%. On a fleet completing 2,000 deliveries daily, that's 180–280 fewer failures per day — $1,440–$3,360 in daily savings from one AI capability.
Trend #2: Predictive Demand Forecasting — AI Moving Inventory Before Customers Click
The most expensive logistics problem in US e-commerce isn't delivery — it's positioning inventory wrong before orders arrive. When a product sells out in a Dallas fulfillment center while 400 units sit idle in a Seattle warehouse, the customer pays overnight shipping costs, the retailer absorbs expedited freight charges, and the delivery window stretches from 2 days to 5. AI demand forecasting attacks this structural inefficiency at its root.
1
Machine Learning Demand Signals — Beyond Historical Sales Data
2026-generation demand forecasting models ingest 40–60 variables simultaneously: historical sales velocity, local weather patterns, regional event calendars, social media trend signals, competitor pricing shifts, and macroeconomic indicators. A model tracking all these signals for a home improvement brand can predict a 340% demand spike for portable generators in a Florida metro 6–8 days before a hurricane forecast drives consumer buying — giving logistics teams time to pre-position inventory at regional DCs before orders flood in.
Example: A mid-market apparel brand using ML forecasting pre-positioned summer inventory across Southern US DCs 11 days before a regional heat wave, reducing split-shipment rate 34% and average delivery distance 28% during the peak demand period.
2
Dynamic Safety Stock — AI-Calculated Buffer by SKU and Region
Static safety stock — setting inventory buffers by category rule — leaves US logistics operations either overstocked (capital tied up, warehouse cost inflated) or understocked (stockouts, expedited shipping cost). AI calculates safety stock dynamically per SKU per fulfillment node, adjusting weekly based on demand volatility, lead time variability, and seasonal patterns. High-velocity SKUs in high-demand metros carry AI-optimized buffers that prevent stockouts without the carrying cost of blanket overstock policies.
Overstock reduction: 20–30%Stockout rate: down 35–45%Carrying cost: reduced 18–24%
3
Last-Mile Integration — Forecasting That Feeds Route Optimization
The highest-value demand forecasting implementations feed directly into last-mile planning — pre-building route capacity in zones projected to spike before orders arrive. If AI predicts a 180% delivery volume increase in Austin's tech corridor Tuesday (based on a regional sales event), dispatch can pre-assign an additional vehicle to that zone Monday night rather than scrambling to add capacity at 7 AM when orders drop. Pre-planned capacity for forecast demand reduces per-delivery cost in peak periods 15–22% versus reactive vehicle deployment.
Integrated forecast-to-route workflow: demand signal → inventory positioning → route capacity planning → optimized dispatch. Each link compounds the efficiency of the next.
AI Fleet Platform for US E-Commerce Logistics
Real-Time Routing + Predictive Analytics — Deployed on Your Fleet in Days
Fleet Rabbit brings AI-powered route optimization, live GPS visibility, driver behavior analytics, and predictive maintenance to mid-market delivery fleets — without the 6-month implementation timeline of enterprise TMS platforms.
22–30%
Fuel Cost Reduction
Trends #3–5: The Three AI Capabilities Reshaping Customer Experience in US Logistics
Beyond internal cost reduction, AI is transforming the customer-facing side of US e-commerce logistics — reshaping expectations around delivery transparency, timing accuracy, and exception communication that directly determine repeat purchase rates.
Trend #3: AI-Powered Real-Time ETA — Eliminating the "Where's My Order?" Call
The customer expectation: 78% of US e-commerce consumers say real-time delivery tracking is now "essential" or "very important" to their purchase decision. The Uber-ification of delivery expectations means a 4-hour arrival window — standard 3 years ago — now triggers customer service contacts and negative reviews.
How AI delivers it: Static ETAs calculated at dispatch degrade in accuracy through the delivery day as traffic, stop dwell times, and route exceptions accumulate. AI-driven ETA models recalculate continuously — updating customer notifications when a vehicle runs 8+ minutes ahead or behind schedule, giving customers accurate 15-minute arrival windows that hold through the delivery day.
Business impact: Accurate real-time ETA reduces "where's my order" customer service contacts 35–45%, cuts failed delivery rate 28–35%, and improves Net Promoter Score 12–18 points on delivery experience ratings.
Trend #4: AI Delivery Scheduling — Customer-Preferred Windows at Logistics Cost
The opportunity: US consumers increasingly expect to choose delivery windows — morning, afternoon, evening — rather than accepting carrier-assigned slots. But offering consumer-preferred scheduling without destroying route efficiency requires AI to sequence customer-selected windows across route geometry simultaneously.
How AI enables it: Next-generation scheduling engines accept delivery window preferences as hard constraints in the optimization model — building routes around customer availability rather than geographic convenience alone. The result: 70–80% of customers get their preferred window while routes remain 85–92% as efficient as unconstrained optimization.
Competitive impact: Retailers offering AI-powered flexible delivery scheduling report 14–19% improvement in checkout conversion on orders where delivery scheduling is displayed — customers are more likely to complete purchase when they control delivery timing.
Trend #5: Proactive Exception Management — AI Communicating Before Customers Complain
The problem: In US e-commerce, 68% of negative delivery reviews cite lack of proactive communication about delays — not the delay itself. A customer who receives an accurate notification 45 minutes before a delay becomes final is 3x more likely to reschedule than complain compared to one who discovers a missed delivery window after the fact.
How AI fixes it: Exception detection AI monitors all active deliveries against planned ETAs — flagging vehicles tracking 15+ minutes late before windows close and triggering customer notifications with accurate revised ETAs and one-tap rescheduling options. Proactive exception management converts what would be failed deliveries into reschedules in 55–65% of cases.
Retention impact: Brands using proactive AI exception communication report 22–28% reduction in delivery-related churn versus reactive exception handling — the difference between a customer who reschedules and one who cancels and switches carriers.
Trend #6: AI-Optimized Returns Routing — Cutting the Hidden Cost of Reverse Logistics
The scale of the problem: US e-commerce return rates average 16–20% across categories — reaching 30–40% in apparel. Reverse logistics costs $10–$20 per returned item when handled reactively. AI is now being applied to returns routing: consolidating return pickups with forward delivery routes, routing returned items to the nearest processing center rather than origin warehouse, and predicting return likelihood by SKU to pre-position processing capacity.
Measured outcomes: AI-optimized reverse logistics reduces cost-per-return 25–35% by route consolidation alone. Integrating return pickups into forward delivery routes adds 8–12% capacity utilization with zero additional vehicle cost — each forward delivery vehicle completing 1–2 return pickups on the route back to depot.
Customer experience impact: Same-day return pickup — enabled by AI route integration — is emerging as a differentiation factor for premium US e-commerce, with conversion lift of 8–12% on high-AOV categories where return anxiety suppresses purchase completion.
Trends #7–10: The AI Infrastructure Layer — Fleet Intelligence That Compounds Over Time
The most durable AI advantages in US e-commerce logistics don't come from single-point applications — they come from intelligence infrastructure that improves continuously as operational data accumulates. These four AI capabilities represent the compounding layer that separates platforms from point solutions.
Trend #7
Driver Intelligence
Trend #7: AI Driver Performance Analytics — Behavior Coaching at Scale
US fleet operators managing 30–200 drivers can't personally observe driving behavior — they rely on incident reports and complaints. AI driver analytics change this entirely: continuous monitoring of harsh braking, aggressive acceleration, speeding, and idle behavior generates driver scorecards that identify the 15–20% of drivers responsible for 60–70% of excess fuel cost and vehicle wear. Targeted coaching from specific behavioral data — "your harsh braking events Thursday cost $47 in excess fuel on Route 12" — produces measurable behavior change within 30 days. Fleets using AI driver coaching report 12–18% fuel consumption reduction from behavior improvement alone, compounding with route optimization savings.
Trend #8
Predictive Maintenance
Trend #8: AI Predictive Vehicle Maintenance — Preventing the $2,400 Mid-Route Breakdown
A delivery vehicle breaking down during the 2–6 PM peak window in a US metro fails 10–16 deliveries, triggers emergency towing ($400–$600), repair at premium rates, and same-day redelivery attempts at 3–5x standard delivery cost. AI maintenance models monitor engine diagnostics, battery health, and fault codes continuously — identifying developing mechanical issues 2–4 weeks before they strand vehicles. Maintenance is scheduled during overnight depot hours instead of discovered mid-shift. At 3–5 breakdown events annually per unmonitored commercial van, AI predictive maintenance reducing breakdown frequency 40% saves $2,880–$4,800 per vehicle annually in direct and indirect cost.
Trend #9
Network Optimization
Trend #9: AI-Driven DC Network Optimization — Right-Sizing the Footprint
The 2026 US e-commerce logistics landscape is defined by pressure to reduce delivery distance — both for cost and for the 2–4 hour windows consumers now expect. AI network optimization models analyze delivery address density, order volume by zip code, and transportation cost by origin-destination pair to identify where adding a micro-fulfillment node or dark store would reduce average last-mile distance 20–35%. Conversely, the same models identify underutilized DC capacity that can be consolidated without increasing delivery cost. Brands running AI network analysis are repositioning fulfillment closer to demand concentration — in suburban rings around major metros where 60–70% of US e-commerce volume originates — reducing average last-mile distance and enabling same-day delivery economics that would be impossible from central urban DCs.
Trend #10
Carrier Intelligence
Trend #10: AI Carrier Performance Intelligence — Data-Driven 3PL Management
US e-commerce operations using multiple carriers — own fleet, UPS/FedEx, regional carriers, gig-economy last-mile — need carrier performance data that goes beyond invoice reconciliation. AI carrier analytics track on-time rate by zip code, damage rate by carrier and route type, cost-per-delivery by service level, and customer satisfaction by carrier assignment — giving logistics managers the data to allocate volume to carriers who perform best for each delivery type and geography. High-value, time-sensitive shipments to verified residential addresses route to carriers with proven performance on that profile. Bulk, lower-AOV volume routes to carriers optimized for cost on that lane. Carrier intelligence allocation typically improves total delivery performance 8–14% while reducing blended per-delivery cost 6–10%.
The 2026 AI Logistics Stack: Combined Performance Across All 10 Trends
18–25%
Last-Mile Cost Per Delivery
22–30%
Fuel Cost Reduction Per Fleet
28–35%
Fewer Failed Delivery Attempts
35–45%
Reduction in WISMO Contacts
20–30%
Inventory Overstock Reduction
45–60
Days to Full Platform ROI
Frequently Asked Questions: AI in E-Commerce Logistics 2026
QHow much does AI route optimization actually save for a mid-size US delivery fleet?
For a 40-vehicle fleet completing 1,600 deliveries daily across a US metro, AI route optimization typically produces $180,000–$260,000 in annual fuel savings, $95,000–$140,000 in failed delivery cost reduction, and $60,000–$90,000 in overtime elimination. Combined with predictive maintenance savings and stop capacity improvements, total annual savings range from $380,000 to $560,000 for a fleet this size. Fleet Rabbit's platform is typically fully paid from fuel and failed-delivery savings alone within 45–60 days of deployment.
QHow is AI changing same-day delivery economics for US e-commerce brands?
Same-day delivery economics in the US have been transformed by AI route optimization working in combination with micro-fulfillment network positioning. AI routing makes same-day delivery operationally viable in suburban metros by completing 35–45 stops per vehicle within 6-hour windows that static routing couldn't achieve. When paired with AI inventory positioning that places high-velocity SKUs within 15–20 miles of 70% of order addresses in a metro, brands can offer same-day for 3–5x fewer vehicles than traditional centralized fulfillment would require — bringing unit economics to a level where same-day can be offered without premium surcharges on orders above $35.
QWhat's the implementation timeline for AI logistics platforms like Fleet Rabbit?
Fleet Rabbit's AI platform deploys in 5–10 days for most mid-market US fleets. Implementation requires three data inputs: delivery address list with time windows (from your OMS via API), vehicle specifications, and depot locations. The optimization engine generates improved routes from day one. AI models improve progressively as historical stop dwell times, driver behavior baselines, and traffic patterns accumulate — typically reaching full optimization accuracy by week 3–4. This contrasts with enterprise TMS implementations that require 4–8 months of configuration before generating value.
QHow are leading US e-commerce brands using AI to compete on delivery experience in 2026?
Leading US e-commerce brands are competing on delivery experience through four AI capabilities: real-time ETA accuracy (15-minute arrival windows that hold through the delivery day), proactive exception communication (AI notifying customers of delays before windows close), flexible delivery scheduling (AI accommodating customer window preferences within optimized route structures), and post-delivery analytics (AI identifying the routes, drivers, and delivery types producing disproportionate customer satisfaction issues). Brands combining all four report 18–24 point improvements in delivery NPS scores within 90 days — with direct correlation to improved 90-day repeat purchase rates.
Related Fleet Rabbit Resources for US E-Commerce Logistics
The four AI capabilities transforming e-commerce fleet operations — real-time GPS visibility, predictive vehicle health monitoring, dynamic route optimization, and delivery performance analytics — with ROI data for each.
AI-driven fault prediction and automated maintenance scheduling that prevents the mid-route breakdowns disrupting delivery windows — the vehicle reliability layer that route optimization depends on.
How real-time utilization tracking, idle reduction analytics, and fleet right-sizing reduce total fleet operating cost for delivery vehicle fleets across US metro markets.
How GPS hardware, IoT vehicle data, and cloud analytics combine to deliver real-time fleet visibility and predictive analytics — the technology infrastructure behind every AI optimization capability.
Deploy AI-Powered Logistics Intelligence on Your US Delivery Fleet
Fleet Rabbit brings all 10 AI logistics capabilities — route optimization, predictive maintenance, driver analytics, real-time ETA, and delivery performance intelligence — through one platform built for mid-market and enterprise US e-commerce fleets. Most operations recover full platform investment within 45–60 days through fuel and failed-delivery savings alone.
22–30% Fuel Savings
28–35% Fewer Failed Deliveries
Real-Time ETA Accuracy
Predictive Maintenance AI
18–25% Lower Cost Per Delivery
May 25, 2026
By John Mark
All Posts