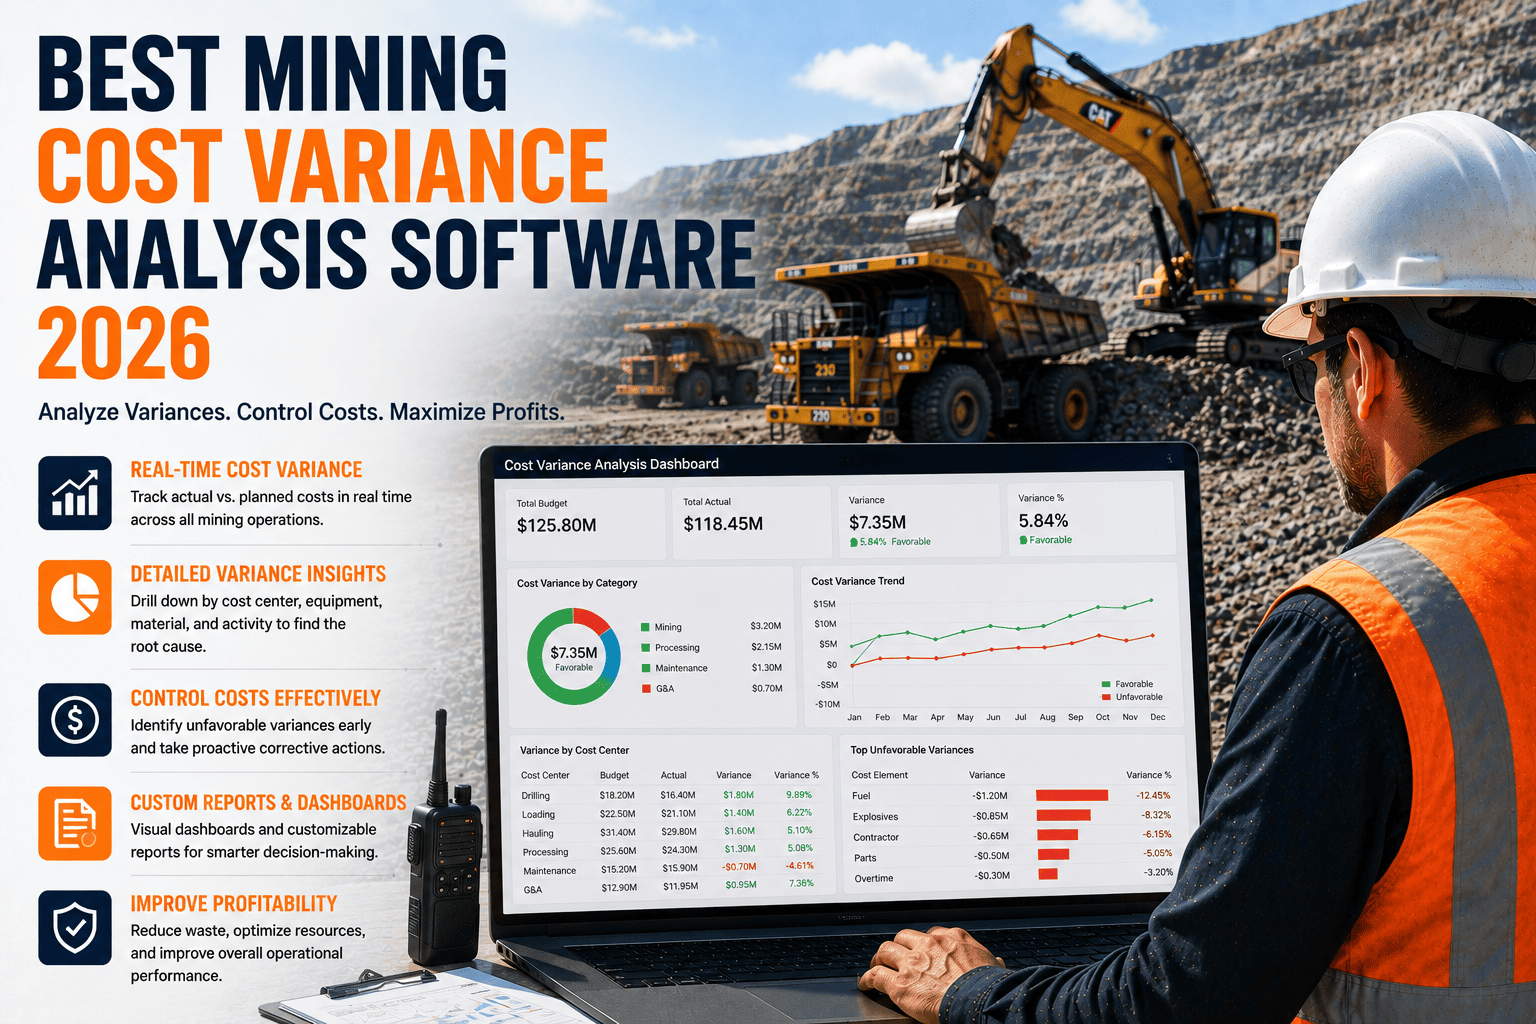
Mining operations run on tight margins, and the gap between what you budgeted and what you actually spent can quietly eat away at profitability for months before anyone notices. A pit that was supposed to cost 4 dollars per tonne to operate creeps up to 5.20 dollars, fuel burn climbs past forecast, contractor invoices come in higher than the quote, and by the time the monthly report lands on your desk, the damage is already done. Mining cost variance analysis software closes that gap by comparing actual spend against budget in near real time, so you catch cost drift while it is still cheap to fix.
Mining projects overrun budget by an average of 30 to 60 percent when cost variance goes untracked, according to industry project-controls research. Sites using dedicated cost variance analysis software identify unfavorable variances 3 to 5 weeks earlier than spreadsheet-based reporting, cutting realized overruns by 20 to 35 percent and improving cost-per-tonne accuracy across pits, fleets, and contractors.
What Mining Cost Variance Analysis Actually Measures
At its core, cost variance analysis compares two numbers: what a mining activity was budgeted to cost and what it actually cost, then explains the gap. A favorable variance means you spent less than planned. An unfavorable variance means costs ran hot, and the software's job is to tell you why, not just that it happened. In mining, that "why" usually traces back to one of a handful of levers: fleet utilization, labor productivity, fuel consumption, blast pattern efficiency, haul cycle times, or contractor billing. Good mining cost variance analysis software connects those operational data points directly to the budget line, so a spike in cost per tonne is automatically linked back to, say, longer haul cycles on Pit 3 rather than left as an unexplained number in a spreadsheet.
The distinction between price variance and efficiency variance matters here. Price variance happens when the cost per unit changes, such as diesel prices rising or a contractor renegotiating rates. Efficiency variance happens when you use more of a resource than planned, such as extra idle time, rework, or excess maintenance hours. Mixing these two together is the single most common mistake in manual cost tracking, because a site manager might chase a fuel efficiency problem when the real issue is a price increase nobody flagged. Dedicated software separates these automatically, which is why teams that switch from spreadsheets to purpose-built platforms typically cut root-cause investigation time by 50 to 70 percent.
Fixed Cost Variance vs Variable Cost Variance
Fixed costs, like equipment leases, site overhead, and permitting fees, rarely swing month to month, so variance here usually signals a contract or scoping error. Variable costs, including fuel, blasting consumables, labor hours, and haulage, fluctuate with tonnage moved and are where 70 to 80 percent of total cost variance in a typical open-pit operation originates. Tracking these two categories separately lets a finance or operations team decide instantly whether a variance needs a contract review or an operational fix.
FleetRabbit connects your fleet, fuel, labor, and maintenance data into one dashboard that flags budget deviations the same day they occur, not weeks later at month-end close. See exactly which pit, fleet, or cost code is driving the variance and act while it is still cheap to correct.
The Cost Drivers That Cause Most Mining Budget Variance
Not every cost line contributes equally to variance. Understanding where the biggest deviations typically originate helps prioritize which data feeds your software needs first.
| Cost Driver | Typical Share of Variance | Common Root Cause | What Software Should Track |
|---|---|---|---|
| Fleet Fuel & Utilization | 25 to 35 percent | Idle time, longer haul cycles, poor route planning between pit and dump | Fuel burn per tonne, engine hours, idle-to-work ratio |
| Labor & Overtime | 15 to 25 percent | Shift overruns, understaffed crews, rework due to quality issues | Hours by cost code, overtime ratio, productivity per crew |
| Equipment Maintenance | 15 to 20 percent | Reactive repairs replacing scheduled maintenance, parts price inflation | Planned vs unplanned repair spend, downtime hours, parts cost trend |
| Drilling & Blasting | 10 to 15 percent | Pattern deviation, explosive overuse, poor fragmentation increasing haul time | Explosive cost per blast, powder factor, fragmentation-linked haul delay |
| Contractor & Third Party | 10 to 15 percent | Rate escalation, scope creep, billing not matched against contract terms | Invoice vs contract rate, scope change log, cost per unit delivered |
| Haulage & Cycle Time | 10 to 12 percent | Queue time at crusher, road condition, longer average haul distance | Cycle time by route, queue minutes, tonnes moved per hour |
Reading the Numbers Correctly
A cost variance report is only useful if it is normalized against production. A pit that spent 8 percent more than budget but moved 12 percent more tonnage actually improved its cost per tonne, and treating that as a red flag wastes management attention. This is why cost per tonne, not raw dollar variance, should be the primary metric your team reviews weekly.
Weekly Review Checklist
Effective sites review four things every week: cost per tonne against budget by pit, top three unfavorable variance line items, fuel and labor efficiency ratios, and any contractor invoice flagged outside contracted rates. Teams that maintain this cadence catch 80 to 90 percent of unfavorable variances before month-end close.
How Mining Cost Variance Analysis Software Works
Purpose-built cost variance platforms pull data from three sources: operational systems (fleet telematics, fuel logs, maintenance records), financial systems (the approved budget and general ledger), and field reporting (shift logs, contractor invoices). The software then automates three functions that used to require a full finance team working from spreadsheets.
Automated Budget vs Actual Comparison
Instead of waiting for a manual reconciliation at month-end, the platform continuously compares actual spend against the phased budget for every cost code, pit, and fleet, updating the variance figure daily or even in real time as new data lands.
Root-Cause Drill-Down
When a variance appears, the system lets a manager click through from the summary number down to the individual truck, shift, or invoice that caused it, cutting investigation time from days to minutes.
Forecast Reforecasting
Rather than treating the annual budget as fixed, modern platforms use current variance trends to project the full-period cost outcome, giving finance teams an early warning if the current trajectory will blow the annual budget before it actually happens.
FleetRabbit ties fuel, maintenance, labor hours, and cycle-time data straight into your cost codes, so budget-versus-actual reporting updates automatically instead of waiting on a spreadsheet reconciliation. Book a walkthrough and see how fast a variance can be traced to its source.
What to Look for in Mining Cost Variance Analysis Software
Not every cost management tool is built for the realities of an open-pit or underground operation. Before you commit to a platform, check that it covers the following, and if you want to see how a fleet-first approach compares, you can book a demo to walk through your own cost structure.
Beyond feature checklists, the platform needs to connect to the data you already generate. If your fleet telematics, fuel cards, and maintenance logs live in separate systems, look for software that ingests all three natively rather than requiring manual exports, because every manual step is another place where variance data goes stale before anyone acts on it.
Benchmarks to Track Once Software Is in Place
Once a variance analysis platform is running, a handful of recurring metrics tell you whether cost discipline is improving or slipping.
Frequently Asked Questions
Cost variance in mining is rarely one big mistake. It is dozens of small deviations across fuel, labor, maintenance, and contractor spend that compound quietly until the monthly report forces a reckoning. The operations that stay profitable are the ones that see the drift while it is still a rounding error, not after it has become a line item the board asks about. Connecting your fleet, fuel, and cost data into one live view is the difference between reacting to overruns and preventing them.
FleetRabbit links fleet, fuel, maintenance, and labor data directly to your budget so unfavorable variances get flagged in days, not weeks. Get a live view of cost per tonne by pit, fleet, and contractor, and put corrective action ahead of the overrun instead of behind it.







