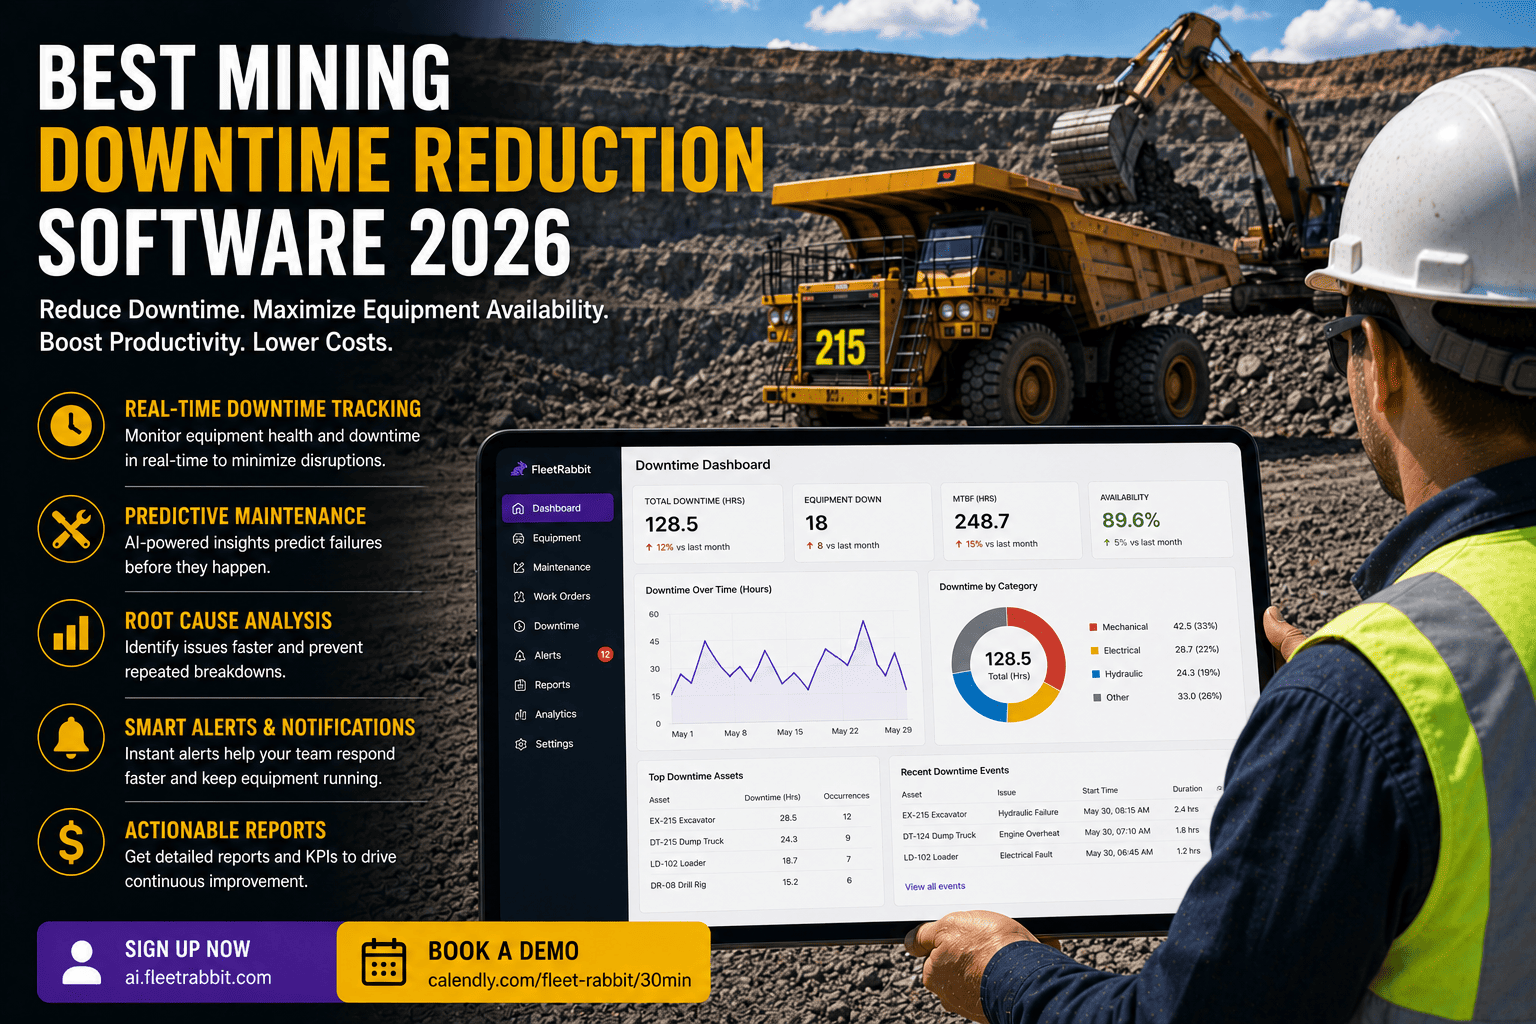
A haul truck sitting idle in an open pit isn't just a truck doing nothing. It's a gap in the haul cycle, a shift target that slips, and a maintenance crew scrambling to source a part that should have been ordered a week ago. Downtime in mining rarely announces itself in advance, and when it does, most operations aren't set up to catch the warning. The equipment is already generating the data that predicts the failure; the question is whether any system is actually watching it. That gap is exactly what mining downtime reduction software is built to close.
The best mining downtime reduction software combines preventive maintenance scheduling, parts inventory planning, and predictive analytics into one system that flags developing failures before they happen and keeps repairs inside planned maintenance windows. Mines running a mature downtime reduction program typically see 15 to 20 percent less unplanned haul truck downtime and up to 30 percent higher asset utilization, with return on investment landing within 6 to 12 months.
Three Places Downtime Actually Comes From
Ask most maintenance teams why a truck went down and the honest answer is usually "we didn't see it coming." That's rarely true at the data level. Almost every major mechanical failure leaves signals in vibration, temperature, or oil condition for weeks before it becomes a breakdown. The failure isn't the surprise; the lack of a system watching for it is.
Reactive Repairs
Fixing equipment only after it fails means every repair happens on the worst possible schedule, at the worst possible cost, with the truck already off the haul road.
Fixed-Interval Maintenance
Servicing everything on a calendar instead of actual condition means healthy components get pulled early while stressed ones sometimes fail before their scheduled check.
Parts Stockouts
A correctly diagnosed failure still costs days of downtime if the replacement part has to be shipped in instead of already sitting in the yard.
FleetRabbit connects to your existing telemetry, tracks parts consumption against real usage, and flags developing failures weeks before they hit the haul road. Sign up for a free trial to see it running against your own fleet data, or book a demo to walk through your current downtime numbers first.
What's Actually Inside a Downtime Reduction Platform
"Downtime reduction software" gets used loosely in the market, and a lot of what's sold under that label is really just a digital version of a paper maintenance log. The systems that move the needle combine four layers working together rather than any single feature on its own.
Preventive Maintenance Scheduling
Automated service intervals tied to actual usage hours and duty cycle, not just the calendar, so nothing gets missed and nothing gets serviced too early.
Predictive Analytics
Vibration, oil, and telemetry data fused into an early-warning model that flags a developing gearbox or differential fault while it's still cheap to fix.
Parts and Inventory Planning
Consumption tracked against real failure patterns so high-turnover parts are already in stock the moment a predictive alert fires, instead of on order.
Real-Time Fleet Monitoring
A single live dashboard across every haul truck, loader, and drill showing current status, upcoming service, and open work orders in one screen.
Why Gearbox and Differential Failures Are the Best Place to Start
Not every component is worth predictive monitoring on day one. Haul truck gearbox and differential failures tend to be the highest-value target because a single unplanned failure can cost between fifty thousand and a hundred and fifty thousand dollars once lost production and emergency repair logistics are added up. Starting a predictive program there, before expanding to engines, tires, and hydraulics, gives a fleet the fastest visible return.
What Good Uptime Actually Looks Like
It's hard to know whether your downtime numbers are a real problem without a benchmark to compare against. These are the reference points worth tracking against your own fleet.
| Metric | Reactive Fleet | Downtime-Optimized Fleet |
|---|---|---|
| Unplanned Haul Truck Downtime | Baseline, no reduction program | 15 to 20 percent lower |
| Asset Utilization | Fixed-interval scheduling only | Up to 30 percent higher |
| Failure Detection Lead Time | Discovered at point of failure | 2 to 4 weeks advance warning |
| Planned vs Unplanned Maintenance Split | Often 50/50 or worse | 80/20 or better |
| Return on Downtime Reduction Investment | Not measured | Positive within 6 to 12 months |
How to Read Your Own Numbers
Pull the last twelve months of maintenance records and separate every incident into planned versus unplanned. If more than a third of your maintenance work is unplanned, the fleet is running reactive rather than proactive, and that ratio alone usually explains most of the downtime cost sitting on your books today.
What the First 90 Days on a New System Looks Like
Weeks 1-2 — Connect and Baseline
Equipment connects to existing telemetry with minimal hardware, and the system starts learning normal operating baselines for each asset.
Weeks 3-6 — First Predictive Alerts
Developing issues that were previously invisible start surfacing, giving maintenance teams their first real lead time on a repair.
Weeks 6-12 — Parts and Scheduling Align
Inventory planning starts matching stock levels to real alert patterns, and preventive schedules shift to match actual component wear.
Day 90 — Measurable Downtime Drop
Maintenance culture shifts from reactive to proactive, with a documented reduction in unplanned breakdowns against your baseline.
Curious what this looks like against your own equipment mix rather than an industry average? Book a demo and bring your last twelve months of downtime data, or sign up to connect your fleet directly and see the first alerts within hours.
FAQ
Your equipment is already generating the data that predicts the next breakdown. FleetRabbit turns that data into early warnings, aligned parts inventory, and a live view of every asset's health across your entire fleet.







