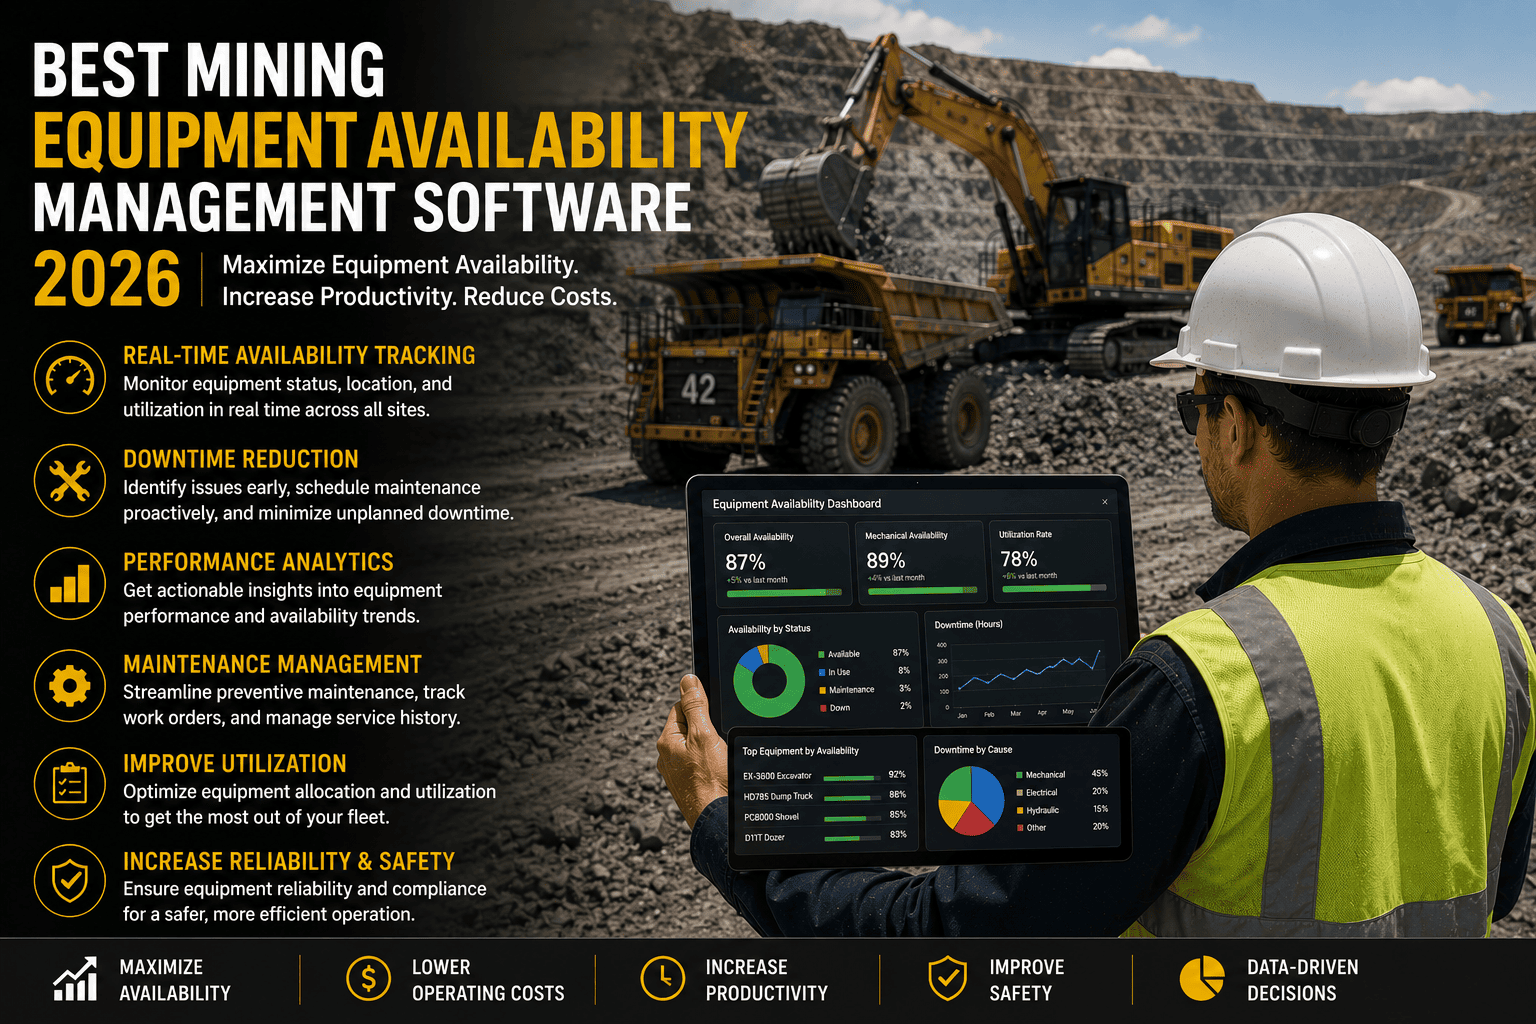
Best Mining Equipment Availability Management Software in 2026

best-mining-equipment-availability-management-software-2026

A haul truck that isn't available isn't just parked, it's a hole in your production plan that ripples through every loader, every shift, and every ton scheduled behind it. Mining equipment availability is the single number that determines how much of your fleet's theoretical capacity actually shows up to work, and the gap between an average site and a world-class one is measured in millions of dollars a year, not thousands.

Equipment Availability Quick Answer

World-class mining fleets achieve 90 to 94 percent availability on haul trucks and shovels, while unplanned downtime on ultra-class trucks costs 5000 to 20000 dollars per hour. Sites without a digital maintenance system run 40 to 55 percent reactive maintenance, compared to 15 to 20 percent for sites using availability management software, and predictive maintenance programs cut unplanned downtime by 30 to 50 percent.

Uptime Target
90 to 94 Percent Is World-Class
Top-performing haul trucks and shovels run at 90 to 94 percent availability. Every point below that target represents production hours the fleet was scheduled to deliver but couldn't.
Downtime Cost
5000 to 20000 Dollars Per Hour
Unplanned downtime on an ultra-class haul truck costs 5000 to 20000 dollars per hour once lost production, idle crew, and cascading delays are counted.
Prevention
30 to 50 Percent Fewer Breakdowns
Predictive and preventive maintenance programs reduce unplanned downtime by 30 to 50 percent, turning emergency repairs into scheduled work.

Why Availability Is the Metric That Actually Matters

Availability measures the percentage of scheduled time a piece of equipment is mechanically ready to operate, and it sits upstream of nearly every other production number a mine tracks. A shovel with poor availability doesn't just lose its own output, it starves the trucks paired to it. A haul truck pulled out of rotation for an unplanned repair forces the remaining fleet to absorb its workload, accelerating wear elsewhere. Availability isn't one metric among many. It's the ceiling every other productivity number gets measured against.

Reactive Maintenance Is the Hidden Availability Tax

Sites running without a digital maintenance system typically operate at 40 to 55 percent reactive maintenance, meaning nearly half of all repair work happens after something has already failed. Sites using structured availability management software cut that to 15 to 20 percent. That difference alone explains much of the gap between average fleets and world-class ones, because reactive repairs cost several times more than the same work done on a planned schedule.

Emergency Repairs Carry Their Own Penalty

Repairs performed under pressure, after a breakdown has already stopped production, typically cost 3 to 5 times more than the identical repair done as planned maintenance, and in cases with cascading delays the total impact can run even higher. That premium is paid every single time a preventable failure is allowed to become an emergency instead of a scheduled work order. Signing up for a free trial shows you exactly how much of your current maintenance spend is paying that emergency premium.

Push Your Fleet Toward World-Class Uptime
Availability Management, Built For Mining

FleetRabbit tracks availability by unit, flags failure risk before it becomes downtime, and shifts your maintenance mix from reactive to planned. Start a free trial with 3 vehicles and see your current availability score today.

90-94%
World-Class Availability
30-50%
Downtime Reduction

Availability Targets By Equipment Type

Not every machine on site should be held to the same availability standard. Equipment class, duty cycle, and operating environment all shift what world-class actually looks like.

Equipment Type World-Class Availability Common Downtime Driver Management Priority
Haul Trucks 92 to 94 percent Tire failures, engine and drivetrain wear, brake system issues Condition monitoring on high-wear components
Shovels and Excavators 90 to 92 percent Hydraulic system failures, bucket and undercarriage wear Scheduled hydraulic inspection and fluid analysis
Drills 88 to 90 percent Rod and bit wear, compressor issues Wear-part tracking tied to actual drilling hours
Loaders 91 to 93 percent Tire and bucket wear, transmission issues Load-cycle monitoring to catch abnormal stress early

How Equipment Availability Management Software Works

Availability management software replaces the guesswork of fixed maintenance calendars with a live picture of which specific units are trending toward failure, so maintenance teams can act before downtime happens instead of reacting after.

Continuous Condition Monitoring

Telematics and sensor data stream engine health, hydraulic pressure, vibration, and fault codes continuously, giving maintenance teams early warning on the specific unit and component drifting out of normal range.

MTBF and MTTR Tracking By Unit

Mean time between failures and mean time to repair are calculated automatically for every machine, surfacing which specific trucks or shovels are chronically underperforming their peers rather than treating the fleet as one average number.

Maintenance Mix Rebalancing

By flagging developing issues early, the software shifts work out of the reactive category and into scheduled maintenance windows, directly reducing the 40 to 55 percent reactive ratio that plagues sites without digital tracking.

Getting the Right Information to the Right Team

Maintenance planners see a prioritized worklist ranked by failure risk. Site leadership sees availability trending against target by equipment class. Procurement sees parts demand coming days or weeks ahead instead of as an emergency order. Booking a demo shows exactly how this looks against your own fleet.

What Availability-Managed Fleets Achieve

Sites that actively manage availability rather than reacting to breakdowns see the improvement compound across uptime, repair cost, and equipment lifespan simultaneously.

Uptime
More Hours Producing
Shifting reactive repairs into planned windows directly recovers production hours that were previously lost to breakdowns.
Cost Control
Lower Repair Cost Per Incident
Planned repairs avoid the 3 to 5 times emergency premium that reactive maintenance carries, saving significant money on identical work.
Equipment Life
Extended Component Lifespan
Catching wear early prevents cascading damage to surrounding components, extending useful life across the fleet.

Getting Started With Availability Management

Most sites already have telematics data flowing from existing equipment, the missing piece is usually a system that turns that data into a ranked, actionable maintenance plan instead of a spreadsheet nobody has time to read. A short trial period is typically enough to surface which specific units are dragging your fleet-wide availability below target and by how much.

From there, the software keeps watching continuously, flagging risk before it becomes an unplanned failure. You can start a free trial to connect your existing fleet data, or book a short demo to walk through your current availability numbers with the team first.

QWhat is a good equipment availability percentage for a mining fleet
World-class targets vary by equipment class, generally 92 to 94 percent for haul trucks, 90 to 92 percent for shovels, 88 to 90 percent for drills, and 91 to 93 percent for loaders. Sites falling meaningfully below these targets typically have significant recoverable uptime.
QHow much does unplanned downtime actually cost in mining
Unplanned downtime on an ultra-class haul truck typically costs 5000 to 20000 dollars per hour once lost production, idle labor, and cascading delays across the fleet are factored in.
QWhat is the difference between reactive and planned maintenance ratio
Sites without a digital maintenance system typically run 40 to 55 percent reactive maintenance, meaning repairs happen after failure. Sites using availability management software cut that ratio to 15 to 20 percent by catching issues before they become breakdowns.
QHow much more expensive is an emergency repair than a planned one
Repairs performed under emergency conditions typically cost 3 to 5 times more than the identical repair completed as scheduled maintenance, due to premium labor, expedited parts, and cascading production delays.
QCan availability management software predict failures before they happen
Yes. By continuously monitoring engine health, hydraulic pressure, vibration, and fault codes, the software flags units trending toward failure early enough to schedule the repair as planned work. Start a free trial to see it against your own fleet data.
QHow quickly does availability management software pay for itself
Because a single prevented major failure on a high-production asset can cost tens of thousands of dollars per hour, most sites see the software pay for itself many times over within the first year through reduced downtime alone.
Stop Reacting To Breakdowns And Start Managing Availability

Every unplanned hour of downtime on a haul truck or shovel costs thousands and ripples through your whole production plan. FleetRabbit flags failure risk early so your maintenance team fixes it on a schedule, not in an emergency.


Equipment Availability Preventive Maintenance Mining Fleet Uptime MTBF and MTTR Tracking Mining Fleet Analytics

July 1, 2026 By John
All Posts

Best Mining Equipment Availability Management Software in 2026

best-mining-equipment-availability-management-software-2026

A maintenance superintendent presents a dashboard showing 89 percent equipment availability. Everyone nods. Two weeks later, the primary crusher goes down for eleven days and costs the site millions in lost throughput. The dashboard wasn't lying, it just wasn't measuring the right thing. Availability numbers are only useful when they're built on the right definitions, tracked consistently, and tied to targets that actually reflect what world-class operations achieve.

Setting a realistic availability target isn't guesswork, and hitting it isn't either. Both come down to two numbers, how often equipment fails and how fast it gets fixed, tracked accurately enough to trust and managed by software built to move them in the right direction.

Quick Answer

The best mining equipment availability management software calculates availability as MTBF divided by MTBF plus MTTR, tracks mechanical and physical availability separately, and benchmarks your fleet against world-class targets of 85 to 95 percent. Improving MTBF by 50 to 100 percent through systematic digital maintenance is achievable and represents tens of thousands of dollars in annual savings per ten machines. Sign up free to see your fleet's real availability numbers.

Two Numbers That Get Confused More Than They Should

Availability sounds like one metric. In practice, mining operations need to track two different versions of it, and conflating them is exactly how a maintenance team gets blamed for a problem that was never theirs to fix.

Mechanical
Mechanical Availability
Measures whether the asset is mechanically capable of operating, regardless of whether it was actually used. This is the number maintenance teams are directly responsible for and should be judged against.
Physical
Physical Availability
Accounts for operational delays too, shift changes, blasting exclusions, weather. A machine can be mechanically sound but still show low physical availability for reasons that have nothing to do with maintenance.
Why It Matters
Confusing the Two Misdirects Blame
A primary crusher can sit at 89 percent mechanical availability while physical availability is only 76 percent because of operational delays. Reporting one number without the other hides exactly where the real problem lives.
Track Both, Blame Neither Team Wrongly
See Mechanical and Physical Availability, Separately

FleetRabbit reports mechanical and physical availability as distinct numbers for every asset, so maintenance and operations both know exactly where an availability gap is actually coming from.

85-95%
World-Class Availability Target
2 Metrics
Tracked Separately, Not Blended

The Formula Every Availability Target Comes From

Availability isn't an opinion, it's the direct output of two other numbers your maintenance data already contains. Once you know both, the target you should be chasing becomes obvious.

The Availability Formula
Availability = MTBF ÷ (MTBF + MTTR)
Mean Time Between Failures (MTBF) is how long equipment runs before an unplanned failure. Mean Time to Repair (MTTR) is how long it takes to get running again. Move either number and availability moves with it.

MTBF: How Often Equipment Fails

A higher MTBF means fewer interruptions overall. Industry average sits at 400 to 600 hours for excavators and loaders, while world-class operations push past 800 hours through predictive maintenance programs that intercept developing failures before they cause a breakdown.

MTTR: How Fast It Gets Fixed

Every breakdown still costs production time, but a fast, well-diagnosed repair costs far less than a slow one. Best-in-class operations achieve MTTR under 6 hours, compared to an industry average of 12 to 18 hours.

Why Both Numbers Have to Move Together

A falling MTTR alongside a falling MTBF means assets are failing more often even as repairs get faster, a maintenance strategy problem, not a technician performance problem. Track both together, and never optimize one in isolation.

Where Your Fleet Stands Against World-Class Benchmarks

These are the reference points every availability improvement plan should be measured against, not industry folklore but documented performance ranges from real mining fleets.

Metric Industry Average World-Class Target
Mechanical Availability Below 85 percent 85 to 95 percent
MTBF (Excavators/Loaders) 400 to 600 hours 800+ hours
MTTR 12 to 18 hours Under 6 hours
Overall Equipment Effectiveness Often below 65 percent 85 percent or higher

What the Software Needs to Actually Move These Numbers

Dashboards that display availability after the fact don't improve it. The platforms that move MTBF and MTTR in the right direction share a specific set of capabilities.

Complete Failure Capture

No MTBF improvement program works if failures go unlogged in radio calls and messaging threads instead of a structured record. Every failure needs to hit the system at the moment it occurs, or the resulting MTBF number is fiction.

Pre-Diagnosis Before the Technician Arrives

The biggest driver of MTTR isn't the repair itself, it's the detection and diagnosis phase beforehand. When the platform has already identified a probable root cause and generated a parts list, technicians walk in repair-ready instead of starting from zero.

Root-Cause Tagging on Every Work Order

Improving MTBF follows a sequence: clean data first, analysis second, automated thresholds third, and root-cause tagging feeding back into all of it. Skip a step and the improvement plateaus.

From Raw Downtime To A Real Availability Plan
Move MTBF and MTTR in the Same Dashboard

FleetRabbit captures every failure at the moment it happens, pre-diagnoses likely causes before a technician arrives, and tracks MTBF and MTTR trends by asset class so your availability target is backed by real data, not a guess.

50-100%
Achievable MTBF Improvement
$45K-75K
Savings Per 10 Machines

Setting a Target You Can Actually Defend

An availability target only means something if it's grounded in your own historical data compared against these benchmarks, not copied from a competitor's press release.

Start With a Clean Baseline

Calculate your current MTBF and MTTR from twelve months of failure records, then compute availability from the formula rather than pulling a number off a dashboard that may already be blending mechanical and physical delays together.

Set Incremental, Not Aspirational, Goals

Jumping from 70 percent to 90 percent availability in one quarter isn't realistic. A 10 percent MTBF gain paired with a 15 percent MTTR reduction is a meaningful, achievable step that compounds month over month. If you want help mapping your baseline against these targets, you can book a demo and walk through your own fleet's numbers.

Mining Equipment Availability Availability Management Software MTBF and MTTR Fleet Uptime Targets Mining Maintenance Benchmarks Equipment Reliability

Frequently Asked Questions

QWhat is the difference between mechanical and physical availability
Mechanical availability measures whether an asset is capable of operating, which is what maintenance teams are responsible for. Physical availability also accounts for operational delays like shift changes or weather, so the two should always be tracked and reported separately.
QWhat is a realistic availability target for a mining fleet
World-class mining fleets achieve 85 to 95 percent mechanical availability. Operations currently well below that range should set incremental improvement targets rather than aiming to close the gap in a single quarter.
QHow is equipment availability actually calculated
Availability equals MTBF divided by the sum of MTBF and MTTR. Improving either mean time between failures or mean time to repair raises the availability percentage, so both metrics need to be tracked together.
QWhat MTBF and MTTR numbers should mining equipment be hitting
Industry average MTBF for excavators and loaders is 400 to 600 hours, with world-class operations exceeding 800 hours. MTTR averages 12 to 18 hours industry-wide, while best-in-class operations achieve under 6 hours.
QWhy did our availability dashboard look fine right before a major failure
A blended or poorly defined availability number can mask a developing problem in a single critical asset. Tracking mechanical and physical availability separately, by asset class, surfaces issues that a single fleet-wide average can hide.
QHow much can improving MTBF actually save
MTBF improvements of 50 to 100 percent through systematic digital maintenance are achievable and typically represent 45000 to 75000 dollars in annual savings per ten-machine fleet through reduced breakdown frequency alone.
Set an Availability Target Backed by Real Numbers

A dashboard that looks fine right up until a major failure isn't measuring the right thing. FleetRabbit tracks mechanical and physical availability separately, captures every failure the moment it happens, and gives you an MTBF and MTTR trend you can actually plan around.

Mechanical Availability Physical Availability MTBF Tracking MTTR Reduction Fleet Uptime

July 11, 2026 By John
All Posts

Share This Story, Choose Your Platform!

Latest Posts

Scroll





